


December 2025 existing-home sales
Existing-home sales rose 5.1% in December to a pace of 4.35 million, 1.4% ahead of the year-ago pace (4.29 million). Pending home sales rose in November from both the prior month and year, as lower mortgage rates improved purchasing power, and this is reflected in December data as well as a modest upward revision to November sales data (now 4.14 million from 4.13 million).
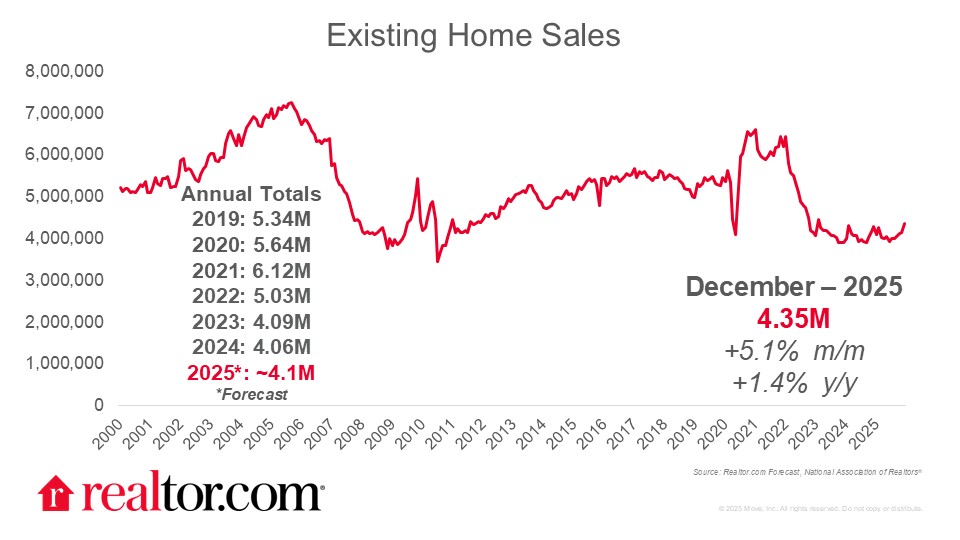
Despite the notable December improvement, this preliminary data shows that 2025 existing-home sales fell just short of the 2024 annual total. In 2025, 4,061,000 homes were sold compared to a 2024 total of 4,062,000. This means that 2025 is now the lowest annual total since 1995, but by a very small margin: a difference of 1,000 home sales.
Mortgage rates ease, benefiting home shoppers
December homebuyers, who would likely have gone under contract in October and November, benefited from rates near their lowest levels in a year, and fortunately, mortgage rates have not climbed since. Mortgage rates have no shortage of potential drivers, from recently announced MBS-buying programs to macro factors like employment and inflation. So far, these factors have largely offset, keeping rates steady to slightly lower, good news for homebuyers, and a trend I expect to continue in 2026. This should help put a firmer floor under sales in the year ahead.
Pickup in home sales tightened the market
Home sales prices grew, with the median price climbing 0.4% from a year ago to $405,400, even as the typical asking price was soft in December. The improved sales price led to a tightened months supply, which dropped from 4.2 months in November to just 3.3 months in December. Seasonal variation in this figure is typical, and despite the month-to-month drop, months supply grew compared to December 2024, when it was 3.2 months. Notably, however, the seasonally adjusted figure also fell back into seller’s market territory, dropping to 3.8 months as buyers responded faster than sellers to mortgage rate relief at the end of 2025. Variation both across and within regions underscores the importance of using local sources to place these national trends in context.
Regional variation reflects different housing supply constraints
All four major regions saw sales climb from last month, with more modest gains in the Northeast and Midwest (+2% each) and larger jumps in the South and West (+6.9% and +6.6%, respectively). From one year ago, sales were flat in the Midwest and West while they rose 3.6% in the South and slipped 1.9% in the Northeast. Price growth continued in the Northeast (3.7%) and Midwest (3.1%), even as prices slipped in the South (-0.3%) and West (-1.4%). This aligns with the Realtor.com® finding that for-sale home inventories are much more recovered in the South and West, with each region registering within 5% or better of their pre-pandemic norm, compared to the Midwest and Northeast, where inventories still lag behind pre-pandemic levels by a third or more.


