


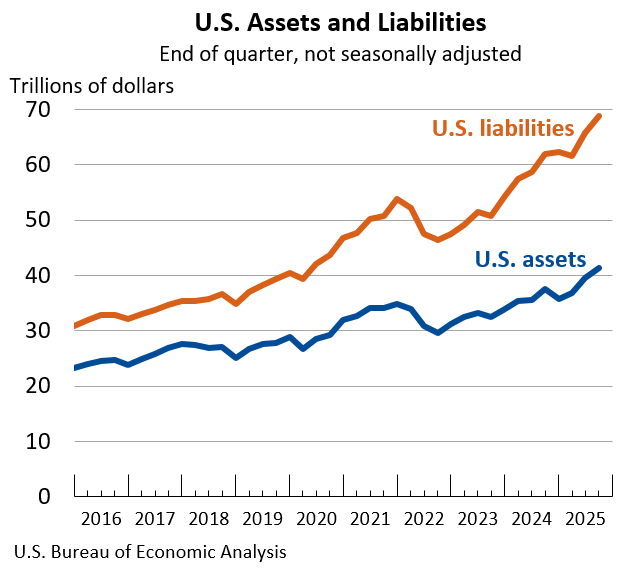
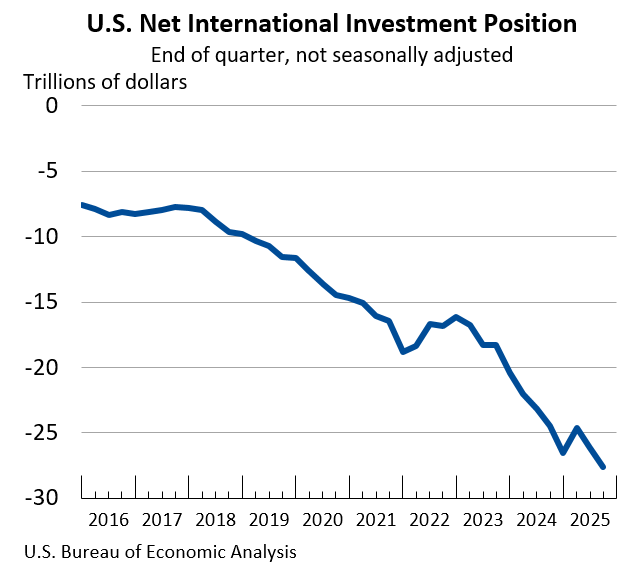
The U.S. net international investment position, the difference between U.S. residents’ foreign financial assets and liabilities, was –$27.61 trillion at the end of the third quarter of 2025, according to statistics released today by the U.S. Bureau of Economic Analysis. Assets totaled $41.27 trillion, and liabilities were $68.89 trillion. At the end of the second quarter, the net investment position was –$26.16 trillion (revised). The net investment position and components of assets and liabilities are presented in table 1.
The –$1.46 trillion change in the net investment position from the second quarter to the third quarter came from net financial transactions of -$386.1 billion and net other changes in position, such as price and exchange-rate changes, of –$1.07 trillion (table 2).
Price changes of –$1.06 trillion reflected U.S. stock price increases exceeding foreign stock price increases, which raised the market value of U.S. liabilities more than U.S. assets.
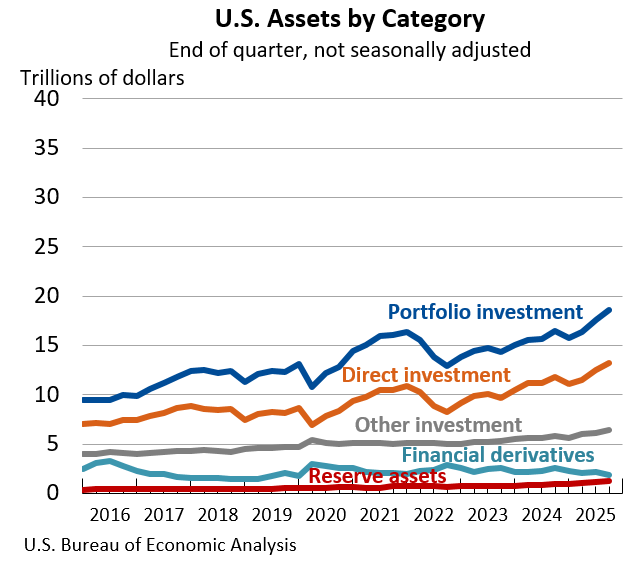
U.S. assets increased by $1.71 trillion to a total of $41.27 trillion at the end of the third quarter, driven by foreign stock price increases that raised the market value of portfolio investment and direct investment assets by $863.0 billion and by $609.4 billion, respectively (table 2). All major investment categories of assets other than financial derivatives increased in the third quarter.
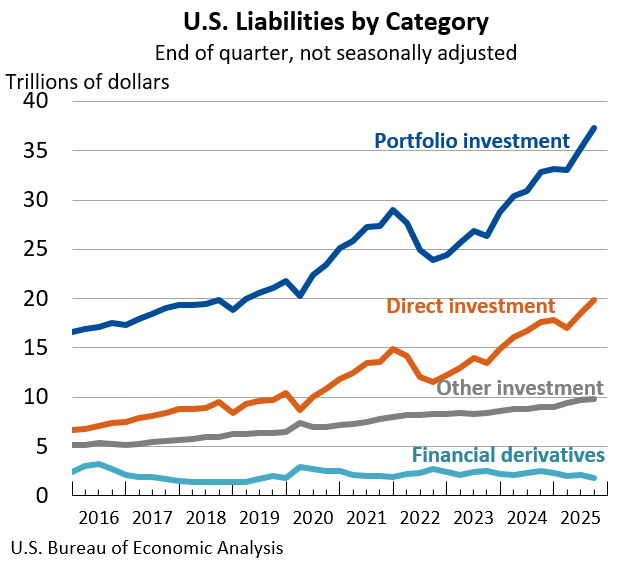
U.S. liabilities increased by $3.17 trillion to a total of $68.89 trillion at the end of the third quarter, driven by U.S. stock price increases that raised the market value of portfolio investment and direct investment liabilities by $1.39 trillion and by $1.20 trillion, respectively (table 2). Financial transactions of $797.8 billion that mostly reflected foreign purchases of U.S. equity and long-term debt securities also contributed to the overall increase in liabilities. All major investment categories of liabilities except financial derivatives increased in the third quarter.
Table A. Updates to Second-Quarter 2025 International Investment Position Aggregates
[Trillions of dollars, not seasonally adjusted]
| Preliminary estimates | Revised estimates | |
|---|---|---|
| U.S. net international investment position | –26.14 | –26.16 |
| U.S. assets | 39.56 | 39.56 |
| U.S. liabilities | 65.71 | 65.72 |
| U.S. Bureau of Economic Analysis | ||
New Combined News Release and Changes in the Presentation of Tables
Beginning in March 2026, BEA will publish the quarterly U.S. international transactions and international investment position accounts in a single news release. This combined quarterly release will provide a broader view of U.S. participation in the global economy and will replace the publication of two separate releases issued on different days, accelerating the availability of international investment position statistics.
In addition, as part of BEA’s ongoing modernization and streamlining of news release packages, the statistics currently published as tables within the releases will not be included in the body of the combined release. Instead, the release will include dynamic links to featured data available in BEA’s Interactive Data Application. This will reduce duplication, increase efficiency, and point data users directly to BEA’s most complete and flexible data tables via links in the release. These customizable tables include full time series and can be downloaded as PDFs, in Excel, or in CSV format.
Next release: March 25, 2026, at 8:30 a.m. EDT
U.S. International Transactions and Investment Position, 4th Quarter and Year 2025
|
U.S. International Transactions and Investment Position Release Dates in 2026 |
|
|---|---|
| 4th Quarter and Year 2025 | March 25 |
| 1st Quarter 2026 and Annual Update | June 24 |
| 2nd Quarter 2026 | September 24 |
| 3rd Quarter 2026 | December 18 |


