


Key takeaways
- The BIS global liquidity indicators (GLIs) show that dollar-denominated foreign currency credit to non-banks in EMDEs fell modestly during Q2 2024. Bank lending declined slightly while international bond issuance held up.
The BIS global liquidity indicators (GLIs) track total credit to non-bank borrowers, covering both loans extended by banks and funding from international bond markets.6 The latter is captured through the net issuance (gross issuance less redemptions) of international debt securities (IDS). The focus is on foreign currency credit denominated in the three major reserve currencies (US dollar, euro and Japanese yen) to non-residents, ie borrowers outside the respective currency areas.
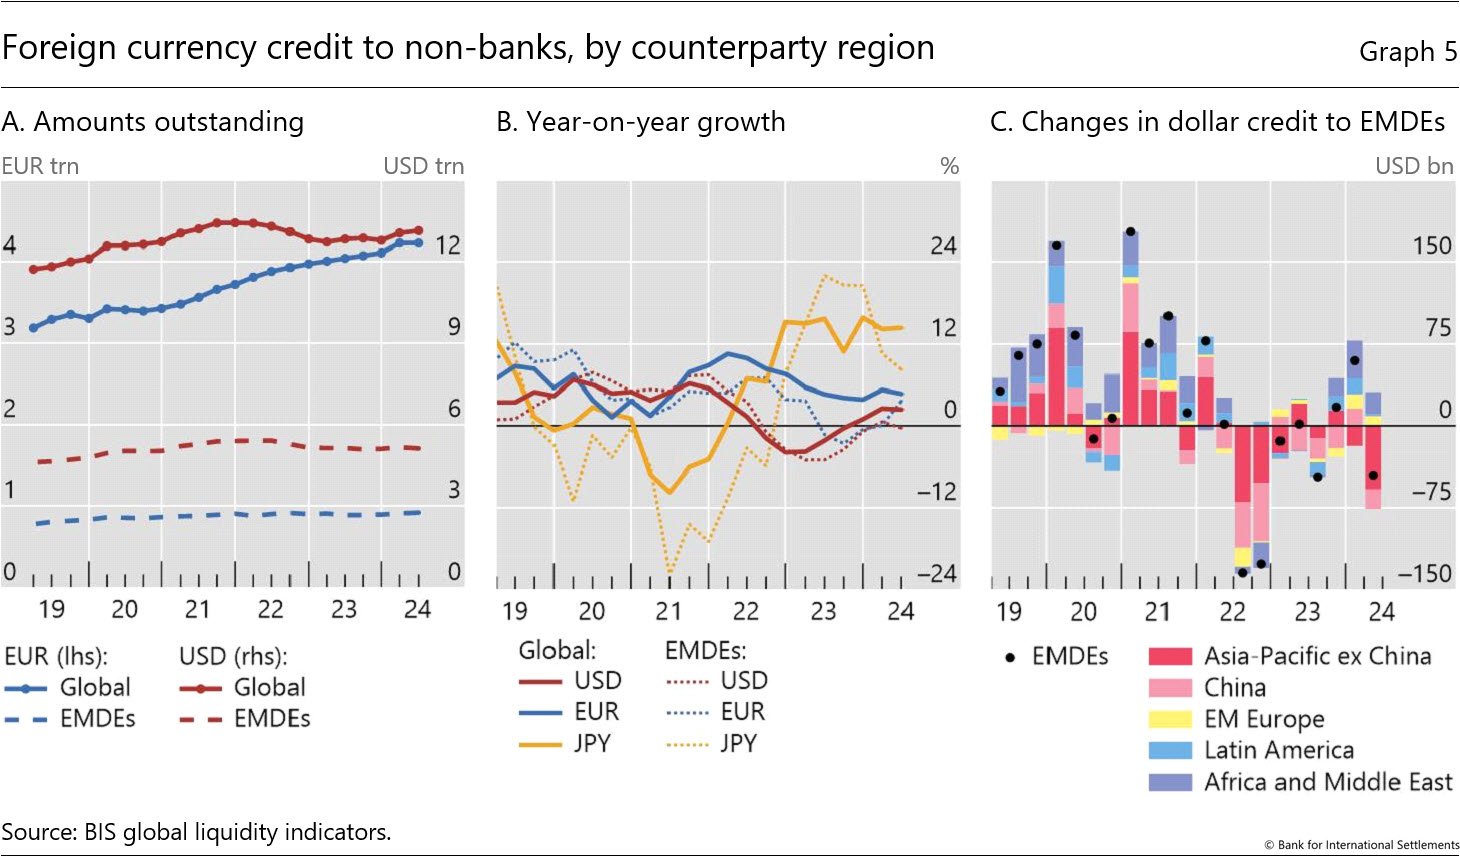
Global foreign currency credit denominated in US dollars and yen saw modest increases, while those in euros fell slightly in Q2 2024. The $87 billion rise in dollar credit to non-banks outside the United States left the outstanding stock at $13 trillion (Graph 5.A, solid red line). The growth rate remained at 2% year-on-year (yoy) (Graph 5.B, red line). Yen credit to non-banks outside Japan also expanded modestly in Q2; the outstanding amount surpassed 64 trillion ($400 billion), up 14% from a year earlier (Graph 5.B, solid yellow line). Euro credit to non-banks outside the euro area rose fell slightly by around 200 million, to 4.2 trillion ($4.5 trillion), but still up 5% from a year earlier (Graph 5, blue lines).
In contrast to the global total, dollar credit to emerging market and developing economies (EMDEs) declined by $45 billion, to $5.1 trillion (Graph 5.A). The drop in dollar credit was more pronounced for borrowers in emerging Asia-Pacific economies, amounting to $76 billion (Graph 5.C). Increases in dollar credit to other EMDE regions did not fully offset this decline. This resulted in almost zero yoy growth in dollar credit to EMDEs overall (Graph 5.B, dotted red line). Another notable feature of dollar credit to EMDEs has been the weakness in the bank lending component (rather than bond financing), extending a trend observed since before the pandemic. Since end-2018, growth in dollar-denominated bank lending (Graph 6.A, dotted red line) has consistently fallen short of growth in bond financing (dotted blue line), by an average of 7 percentage points.
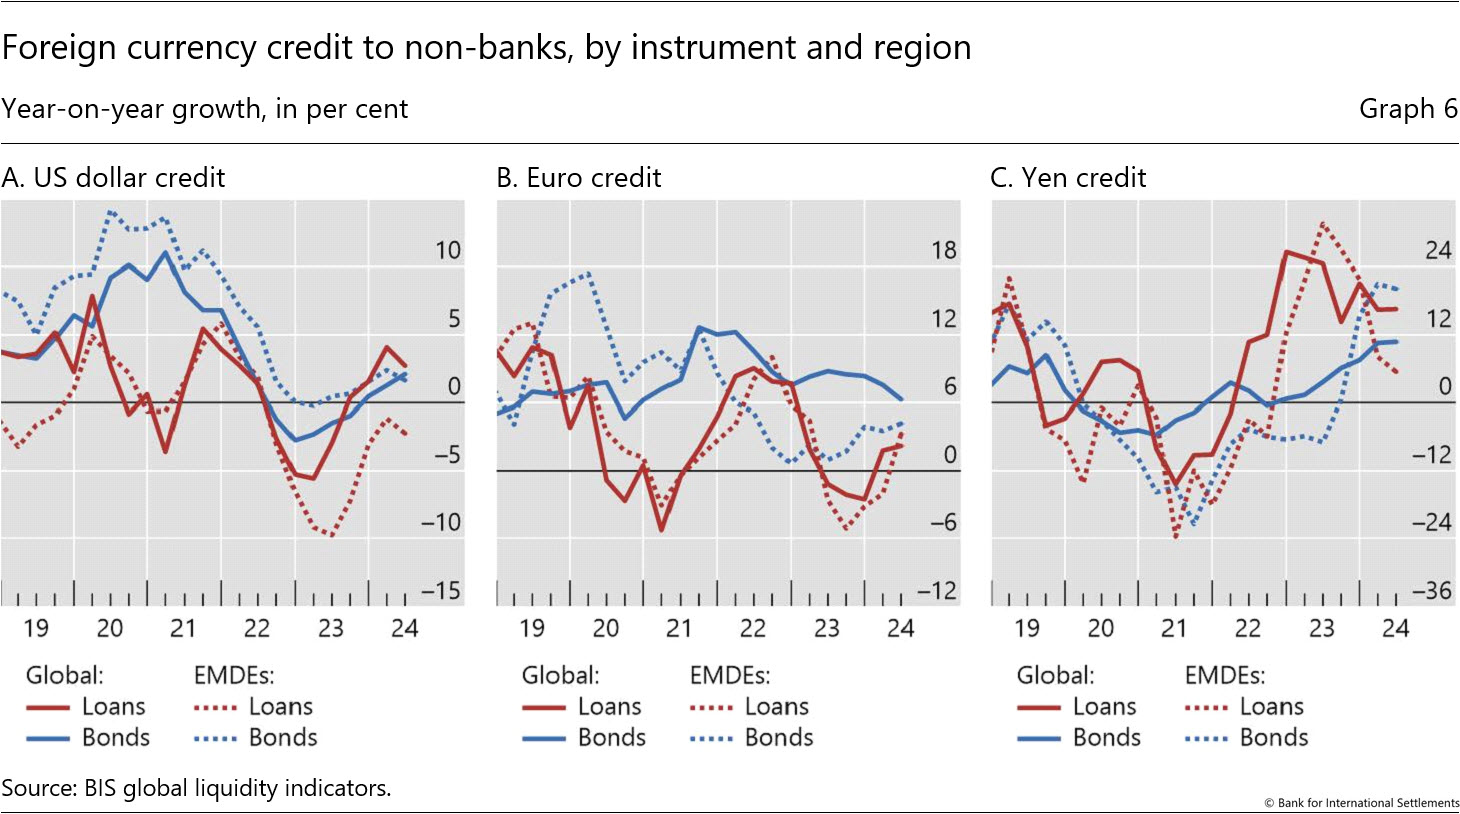
The disparity in growth between bank lending and bond financing to EMDE borrowers observed in dollar credit also stood out in the euro segment, but not in the yen segment. Since end-2018, growth in euro bank lending has been 3 percentage points below that in bond financing on average, despite signs of recovery in loan growth in the most recent period (Graph 6.B). For the yen, low interest rates and yen depreciation through mid-2024 went hand in hand with a surge in bank lending since mid-2022, although growth has slowed in 2024 (Graph 6.C).


