


Highlights
- The rate of foreclosures has ticked up in recent years after a period of suppression following the COVID-19 pandemic. Foreclosures are now about as common as they were in 2019, but well below the levels seen during the Great Financial Crisis.
- Foreclosed homes go to auction, and if their reserve price is not met, they become Real Estate Owned (REO) and are listed by the lender on the MLS. Realtor.com® data shows that REOs were 1.3% of active listings in April.
- The median REO home that sells does so for a price that is 27.2% less than its estimated value. This discount, however, was even higher when the housing market was hotter and there were fewer foreclosed homes for sale.
- REO listings are concentrated in low-cost markets, and though they draw 26.5% more page views than typical listings, they spend 11 days longer on the market.
Foreclosure is the legal process by which a lender terminates a homeowner’s right to their property after the borrower fails to meet their mortgage obligations. The lender, usually a bank or mortgage servicer, initiates proceedings to take possession of the property and sell it to recoup the outstanding loan balance after the borrower has stopped making payments. Though often associated with economic downturns, foreclosures occur in all market conditions and affect homeowners across all demographics and geographies.
This report aims to provide some context around the state of foreclosures in the U.S. housing market, but also to offer insights on what happens to homes after foreclosure. We will examine the discounts available on homes sold through foreclosure, identify markets with the most foreclosure listings, and break down the performance of those foreclosed homes after they have been listed for sale.
Context
Currently, foreclosures are on the rise from a very low level. During the pandemic, several policy interventions such as the Coronavirus Aid, Relief, and Economic Security (CARES) Act’s foreclosure moratorium and mortgage forbearance program drastically reduced the number of homeowners who went into foreclosure. After these programs expired, foreclosure rates remained low, due partly to the fact that many homeowners saw major gains in home equity during the period. In addition, Fannie Mae and Freddie Mac offered COVID-19-era forbearance, payment deferral, and loan modification programs that were only started to be phased out in 2024. However, since 2024, foreclosures have begun to creep back up in line with their pre-pandemic pace.
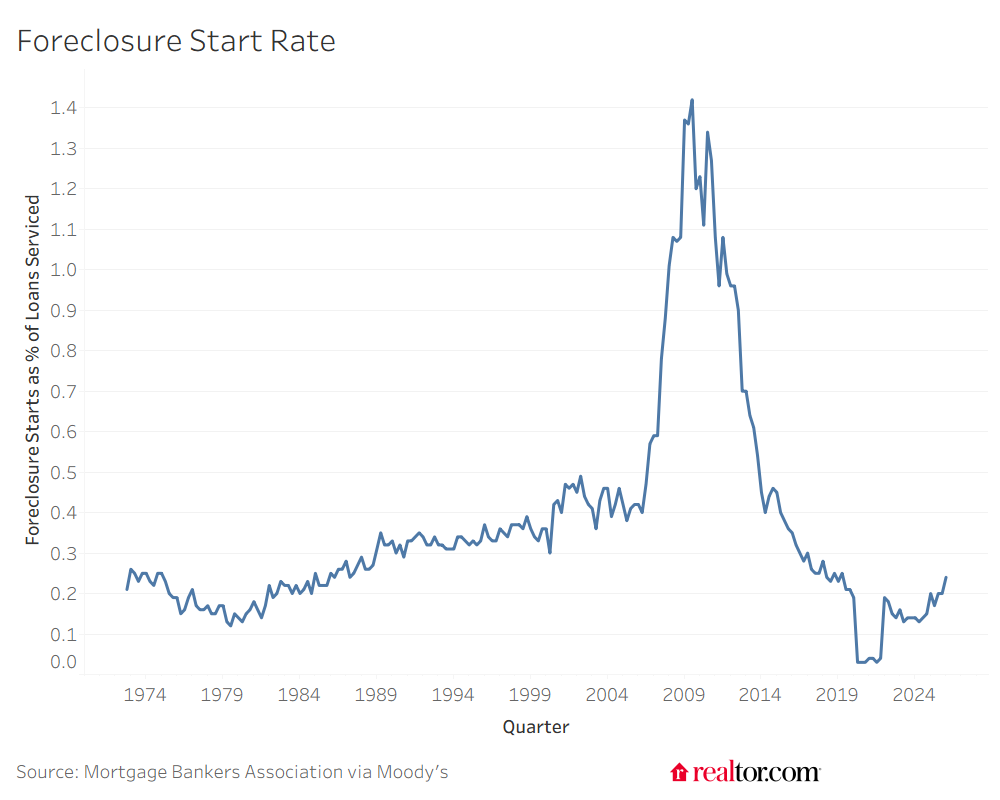
The current rise in the foreclosure rate is no doubt a symptom of the affordability crisis currently affecting the housing market. This crisis extends beyond the high cost of entry, as housing supply has fallen short of demand, pushing up prices for over a decade, and now affects monthly carrying costs. Those who bought with adjustable-rate mortgages are seeing their monthly payments increase as rates remain elevated. Property taxes continue to grow with home values and are often increasing in rate terms as well. Homeowners insurance premiums are on the rise as climate concerns and the cost of replacing home components grow. Homeowners associations are more common and are charging more. At the same time, the cost of living generally is increasing at a rate faster than wages, so it’s harder for homeowners to keep up, and more are falling behind and eventually defaulting on their mortgages.
Buyers since 2023, when home prices flattened off, are most at risk. They’re newer to their mortgage and don’t have as much of an equity stake in their home, partly because the first few years of mortgage payments are made up of significantly more interest than principal and partly because their home has not appreciated as much as those that were purchased before the price surge of 2021 and 2022. The risk of being “underwater” (owing more on a home than it is worth) is most acute for this group.
Though foreclosure is certainly a painful process for the residents of the home, leading to their displacement and long-term credit detriment, it presents an opportunity for savvy buyers and investors looking to buy homes for well below market value.
After a home is foreclosed on, it goes up for auction by the county, with the lender setting a reserve price below which the home cannot be sold. If the auction is successful, the lender is paid the proceeds and the buyer is tasked with formal eviction. If the reserve price is not met at auction, the property goes up for sale as Real Estate Owned (REO) by the lender, usually being listed on the local multiple listing service (MLS) and published on sites such as Realtor.com. Most lenders are prohibited from being in the business of managing properties long term and look to dispose of these assets as quickly and efficiently as possible. More homes being foreclosed on means more homes up for sale at auction or by lenders on the MLS. Because there are plenty of risks and complications that come with buying a foreclosed home, such as buying it without being able to inspect it inside (if bought at auction), being required to pay in cash, and navigating murky title details, their pricing reflects these challenges. Put simply, they tend to be priced below similarly located and appointed homes.
Quantifying the REO discount
Just how good a deal can be found from buying a foreclosed home? To answer that question, we took a look at home sales records that indicate the home was sold as a foreclosure REO sale, and compared those sale prices to the estimated value of the home during the month it was sold as determined by our automated valuation models (AVM). The median discount since 2018 has ranged from about 20% to about 35% on a monthly basis. In April 2026, the median foreclosed home was sold for a discount of 27.2% from its AVM valuation.
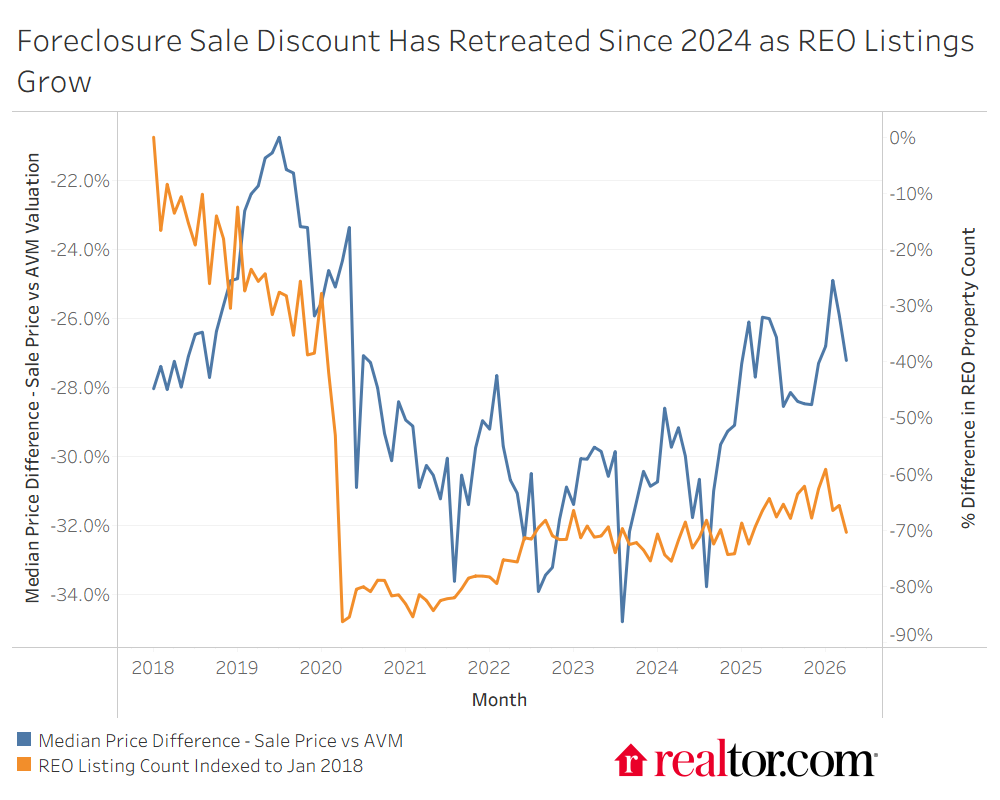
The foreclosure sales discount grew from 2020 to 2022, when there were the fewest foreclosed homes available for purchase, and in more recent years, as foreclosure rates have ticked back up, the discount has lessened. In fact, the share of listings on the market constituted by foreclosed homes nationally reached its highest April level in 2026 (1.3% of listings) since 2020 (1.7% of listings). This is curious behavior, as basic economics would suggest that an increase in the supply of foreclosed homes would lower their prices (increasing the discount). What is more likely happening here is a return to a long-run equilibrium value of the REO discount after a period in which the discount was overstated by fast-growing AVM valuations. These models took into account the rapid price growth of the post-COVID-19 buying frenzy and may have overstated the theoretical value of the homes sold from 2022 to 2024, inflating the value of the REO discount during this period. As home prices have flattened in 2025 and 2026, AVM growth has slowed and the foreclosure discount has shrunk a bit.
Where foreclosure listings are concentrated
The metro areas with the most foreclosure listings, unsurprisingly, tend to be large ones with lots of listings in general. The table below shows the number of foreclosed homes for sale in the 10 metropolitan areas with the most foreclosure listings as of June 2026.
| Metro | Foreclosure Listings |
| Chicago-Naperville-Elgin, IL-IN | 611 |
| Philadelphia-Camden-Wilmington, PA-NJ-DE-MD | 586 |
| Houston-Pasadena-The Woodlands, TX | 579 |
| Baltimore-Columbia-Towson, MD | 360 |
| Phoenix-Mesa-Chandler, AZ | 347 |
| Miami-Fort Lauderdale-West Palm Beach, FL | 319 |
| Pittsburgh, PA | 290 |
| Washington-Arlington-Alexandria, DC-VA-MD-WV | 285 |
| St. Louis, MO-IL | 218 |
| Austin-Round Rock-San Marcos, TX | 214 |
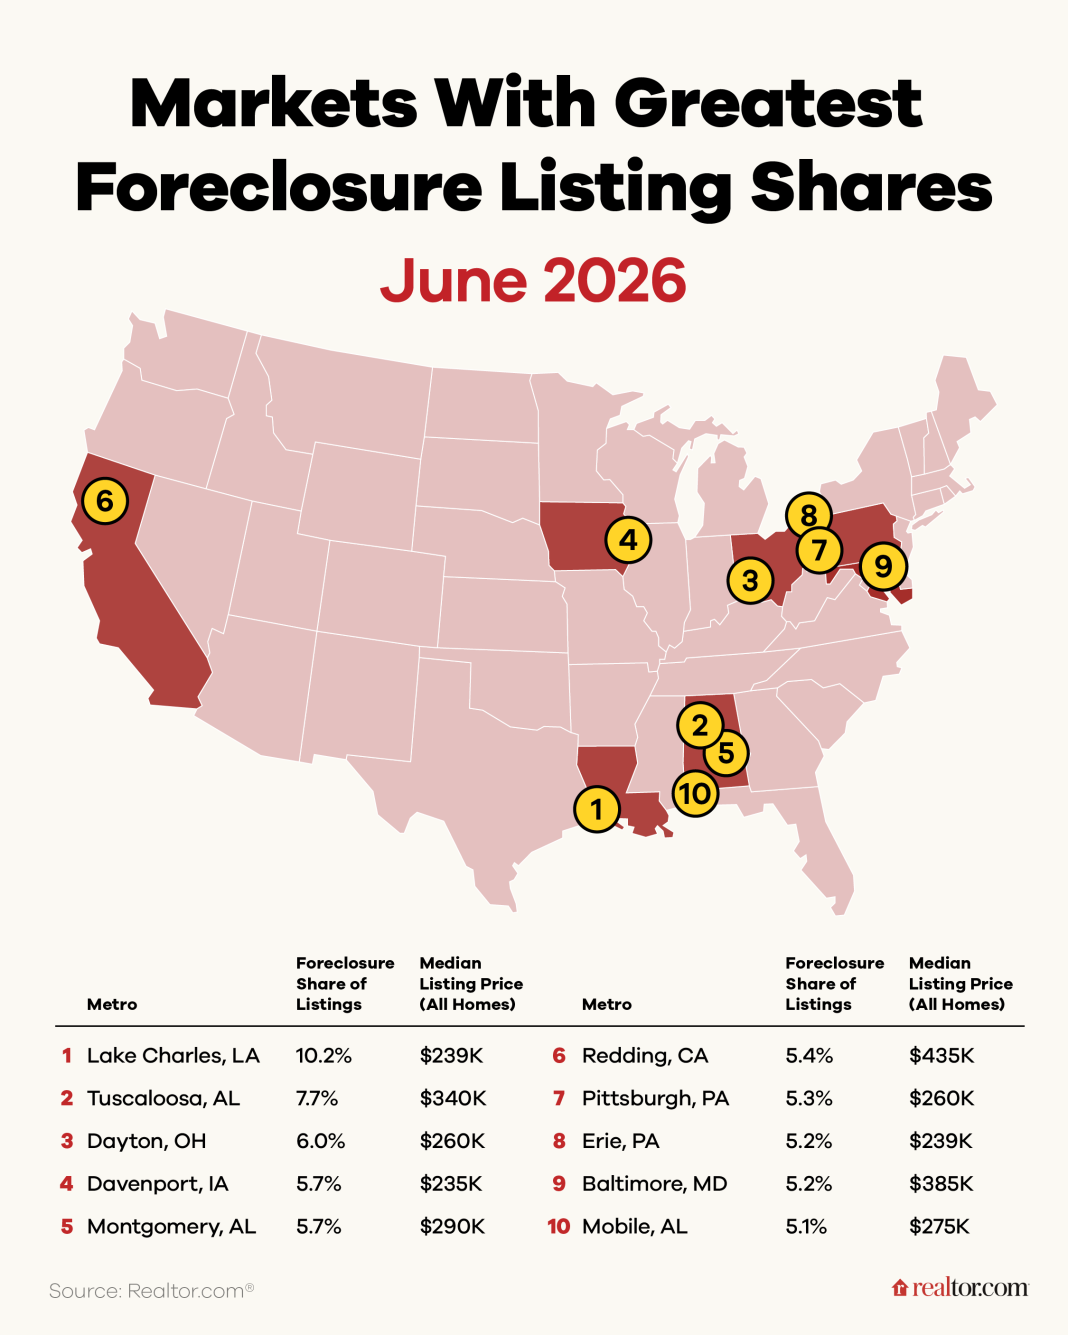
Absent from the list are the two largest metros in the U.S.: New York City and Los Angeles. Also, appearing further up the list than expected are some smaller metros such as Baltimore, Pittsburgh, St. Louis, and Austin. Some lower-priced metros seem to be making their way toward the top of the foreclosure listings table, and this trend is even more evident when looking at the top metros in terms of the percentage of listings for sale that are foreclosures.
| Metro | Foreclosure Share of Listings | Median Listing Price (All Homes) |
| Lake Charles, LA | 10.2% | $238,700 |
| Tuscaloosa, AL | 7.7% | $339,900 |
| Dayton-Kettering-Beavercreek, OH | 6.0% | $260,000 |
| Davenport-Moline-Rock Island, IA-IL | 5.7% | $235,000 |
| Montgomery, AL | 5.7% | $289,575 |
| Redding, CA | 5.4% | $435,248 |
| Pittsburgh, PA | 5.3% | $259,900 |
| Erie, PA | 5.2% | $238,675 |
| Baltimore-Columbia-Towson, MD | 5.2% | $384,750 |
| Mobile, AL | 5.1% | $274,999 |
Only Redding, CA, has a median listing price higher than the national median, but it is one of the most affordable metros in California. The rest are deeply affordable or, in the case of Baltimore, moderately affordable in its own right but an improvement upon its neighboring metros. These low-priced metros see more foreclosures because the homeowners there are closer to the margin of homeownership than in higher-priced metros. In fact, the average down payment on homes bought since 2025 in each of these metros is lower than the national average in dollar terms. In percentage of purchase price terms, only Pittsburgh has higher down payments than the national average. The affordability advantages of these metros that made homeownership possible for buyers on the margin lead to a selection bias that leaves the typical homeowner more susceptible to foreclosure.
In some areas, the rules heavily affect market outcomes. The state of Alabama, for example, home to three of these REO-heavy metropolitan areas, has a structural deterrent to auction purchases that leads foreclosed homes to disproportionately end up as REOs. It is a statutory right of redemption, which allows the former homeowner to reclaim their property after a foreclosure sale by paying the buyer’s purchase price plus interest, taxes, insurance, and other allowable charges. Even after you’ve closed on the property, the prior owner can force you to give it up, which creates serious risk, especially for buyers planning to build or remodel immediately. Alabama is not the only state with a statutory right of redemption, but its redemption period is longer than most, applies to all foreclosures, and allows any party with an interest in the property (such as contractors, ex-spouses, or mortgage holders) to redeem. Because of this potential complication, few investors are interested in Alabama foreclosures at auction, and more end up as REOs.
Foreclosure listing performance
With their attractive price points (the median foreclosure listing is priced more than 30% below other listings of the same type in the same area), foreclosure listings get a lot of attention. In the first half of 2026, the median foreclosure listing got 26.5% more page views on Realtor.com than the typical listing in the same geography. These extra eyeballs do not equate to faster home sales, though. The median foreclosure listing in the first half of 2026 had spent 11 more days on the market than the typical standard-offering home listing in the same area.
One possible explanation for more eyeballs and slower sales is that REO listings are a more specific product that will not work for every buyer. The typical REO listing on the MLS does not get as much TLC from its lender-seller as the traditional resale home gets from its listing agent, and REO listings tend to be lower quality. REO listings have 30.4% fewer photos and 33.0% shorter listing descriptions.
Though REO purchases are much more buyer-friendly than foreclosure auction purchases, as the buyer can use traditional mortgage products and inspect the home’s interior, there are still some risks that make buyers take their time. REO sales usually occur as-is, while typical home purchases may involve the seller completing some work on the house. Given that the condition of the foreclosed home may be suboptimal, this can dissuade buyers who don’t have the expertise or extra cash to handle repairs.
Methodology
Foreclosure sales are identified as those with the REO sale flag in Realtor.com deed data. Foreclosure listings are identified as those with the REO flag in Realtor.com listing data. AVM valuations are computed by taking the median of each property’s valuations within the month that the home sold, and the sale price is compared against the valuation to compute the discount. Listing performance metrics are computed by comparing the statistics for each listing against the medians for that listing’s property type and ZIP code if there are at least 50 listings in the ZIP code or metro area if there are not 50 listings in the ZIP code. The difference between the individual listing’s metrics and the local median is computed, and the median of those differences is taken to determine the overall difference between foreclosure listings and typical listings.
Appendix: Top 100 Metros
| Metro | Foreclosure Share of Listings | Median Listing Price (All Homes) |
| Albany-Schenectady-Troy, NY | 1.3% | $449,900 |
| Albuquerque, NM | 1.8% | $420,075 |
| Allentown-Bethlehem-Easton, PA-NJ | 1.7% | $425,000 |
| Atlanta-Sandy Springs-Roswell, GA | 0.1% | $429,000 |
| Augusta-Richmond County, GA-SC | 2.1% | $315,125 |
| Austin-Round Rock-San Marcos, TX | 1.7% | $473,500 |
| Bakersfield-Delano, CA | 0.7% | $410,000 |
| Baltimore-Columbia-Towson, MD | 5.2% | $384,750 |
| Baton Rouge, LA | 1.3% | $299,900 |
| Birmingham, AL | 4.0% | $300,000 |
| Boise City, ID | 1.1% | $625,000 |
| Buffalo-Cheektowaga, NY | 2.7% | $272,500 |
| Cape Coral-Fort Myers, FL | 1.3% | $396,850 |
| Charleston-North Charleston, SC | 0.0% | $499,925 |
| Charlotte-Concord-Gastonia, NC-SC | 0.4% | $440,000 |
| Chattanooga, TN-GA | 1.0% | $399,900 |
| Chicago-Naperville-Elgin, IL-IN | 4.4% | $394,500 |
| Cincinnati, OH-KY-IN | 1.0% | $354,900 |
| Cleveland, OH | 0.1% | $277,000 |
| Colorado Springs, CO | 0.6% | $497,000 |
| Columbia, SC | 1.1% | $307,461 |
| Columbus, OH | 2.7% | $394,500 |
| Dallas-Fort Worth-Arlington, TX | 0.1% | $439,990 |
| Dayton-Kettering-Beavercreek, OH | 6.0% | $260,000 |
| Deltona-Daytona Beach-Ormond Beach, FL | 0.6% | $379,795 |
| Denver-Aurora-Centennial, CO | 0.6% | $589,000 |
| Detroit-Warren-Dearborn, MI | 1.8% | $275,000 |
| Durham-Chapel Hill, NC | 0.1% | $487,450 |
| El Paso, TX | 1.1% | $309,725 |
| Fresno, CA | 1.6% | $480,000 |
| Grand Rapids-Wyoming-Kentwood, MI | 0.2% | $432,475 |
| Greensboro-High Point, NC | 0.1% | $333,388 |
| Greenville-Anderson-Greer, SC | 0.5% | $389,900 |
| Harrisburg-Carlisle, PA | 1.9% | $350,000 |
| Houston-Pasadena-The Woodlands, TX | 1.7% | $362,265 |
| Indianapolis-Carmel-Greenwood, IN | 0.2% | $321,450 |
| Jackson, MS | 2.2% | $288,950 |
| Jacksonville, FL | 0.1% | $399,000 |
| Kansas City, MO-KS | 1.5% | $415,000 |
| Kiryas Joel-Poughkeepsie-Newburgh, NY | 0.1% | $595,000 |
| Knoxville, TN | 1.2% | $462,450 |
| Lakeland-Winter Haven, FL | 1.9% | $335,000 |
| Las Vegas-Henderson-North Las Vegas, NV | 1.3% | $474,950 |
| Los Angeles-Long Beach-Anaheim, CA | 0.5% | $1,099,950 |
| Madison, WI | 0.3% | $497,906 |
| McAllen-Edinburg-Mission, TX | 2.0% | $260,000 |
| Memphis, TN-MS-AR | 0.3% | $302,500 |
| Miami-Fort Lauderdale-West Palm Beach, FL | 0.7% | $499,000 |
| Minneapolis-St. Paul-Bloomington, MN-WI | 2.1% | $439,450 |
| Nashville-Davidson–Murfreesboro–Franklin, TN | 0.0% | $539,945 |
| New Orleans-Metairie, LA | 5.1% | $299,000 |
| New York-Newark-Jersey City, NY-NJ | 0.2% | $792,000 |
| North Port-Bradenton-Sarasota, FL | 1.1% | $485,000 |
| Orlando-Kissimmee-Sanford, FL | 1.1% | $419,990 |
| Oxnard-Thousand Oaks-Ventura, CA | 0.3% | $984,735 |
| Palm Bay-Melbourne-Titusville, FL | 0.4% | $375,000 |
| Philadelphia-Camden-Wilmington, PA-NJ-DE-MD | 4.7% | $389,900 |
| Phoenix-Mesa-Chandler, AZ | 1.9% | $489,500 |
| Pittsburgh, PA | 5.3% | $259,900 |
| Port St. Lucie, FL | 1.4% | $432,500 |
| Portland-South Portland, ME | 0.2% | $650,000 |
| Portland-Vancouver-Hillsboro, OR-WA | 1.5% | $598,950 |
| Providence-Warwick, RI-MA | 1.0% | $599,675 |
| Raleigh-Cary, NC | 0.2% | $457,000 |
| Richmond, VA | 0.2% | $450,000 |
| Riverside-San Bernardino-Ontario, CA | 0.5% | $595,000 |
| Rochester, NY | 2.3% | $324,900 |
| Sacramento-Roseville-Folsom, CA | 2.0% | $629,500 |
| Salt Lake City-Murray, UT | 0.1% | $570,450 |
| San Antonio-New Braunfels, TX | 0.3% | $325,000 |
| San Diego-Chula Vista-Carlsbad, CA | 0.4% | $929,000 |
| San Francisco-Oakland-Fremont, CA | 1.9% | $996,500 |
| San Jose-Sunnyvale-Santa Clara, CA | 0.2% | $1,385,000 |
| Scranton–Wilkes-Barre, PA | 0.8% | $278,450 |
| Seattle-Tacoma-Bellevue, WA | 1.4% | $783,250 |
| Spokane-Spokane Valley, WA | 2.0% | $499,000 |
| St. Louis, MO-IL | 3.5% | $290,000 |
| Stockton-Lodi, CA | 1.5% | $599,463 |
| Syracuse, NY | 4.1% | $319,950 |
| Tampa-St. Petersburg-Clearwater, FL | 1.2% | $399,925 |
| Toledo, OH | 1.8% | $224,950 |
| Tucson, AZ | 1.9% | $385,000 |
| Urban Honolulu, HI | 0.1% | $677,350 |
| Virginia Beach-Chesapeake-Norfolk, VA-NC | 0.6% | $439,100 |
| Washington-Arlington-Alexandria, DC-VA-MD-WV | 1.9% | $585,000 |
| Winston-Salem, NC | 0.1% | $338,000 |