


Highlights
- National luxury prices fell to $1,277,907 in June, down 1.7% year over year, the 27th consecutive month of annual decline and a wider drop than May’s 1.4% pace.
- Luxury homes are still moving faster than a year ago across every tier, with the 90th percentile selling in a median of 63 days, 2 days faster than in June 2025.
- Bridgeport-Stamford-Danbury, CT, held the top spot among the most expensive luxury markets for a second straight month, while San Francisco-Oakland-Fremont, CA, returned to the top 10 after Santa Rosa-Petaluma, CA, fell below the 500-listing eligibility threshold.
- San Jose-Sunnyvale-Santa Clara, CA, posted the steepest annual decline among the top 10 most expensive markets (-11.7%), while Naples-Marco Island, FL, was the lone market in the group with positive year-over-year growth (+4.1%).
- Nantucket, MA, has the highest concentration of vacation homes in the country at 55.0% of its housing stock, roughly 17 times the national share of 3.3%, and also ranks among the most expensive luxury markets by price.
National Luxury Overview
| Pricing | June 2026 | Monthly Change | YoY Change |
| Luxury Threshold 90th Percentile | $1,277,907 | -0.4% | -1.7% |
| High-End Luxury Threshold 95th Percentile | $1,997,691 | -0.1% | -3.7% |
| Ultraluxury Threshold 99th Percentile | $5,513,735 | -0.9% | -2.9% |
| Million-Dollar Listing Share | 13.7% | -0.1pp | -0.5pp |
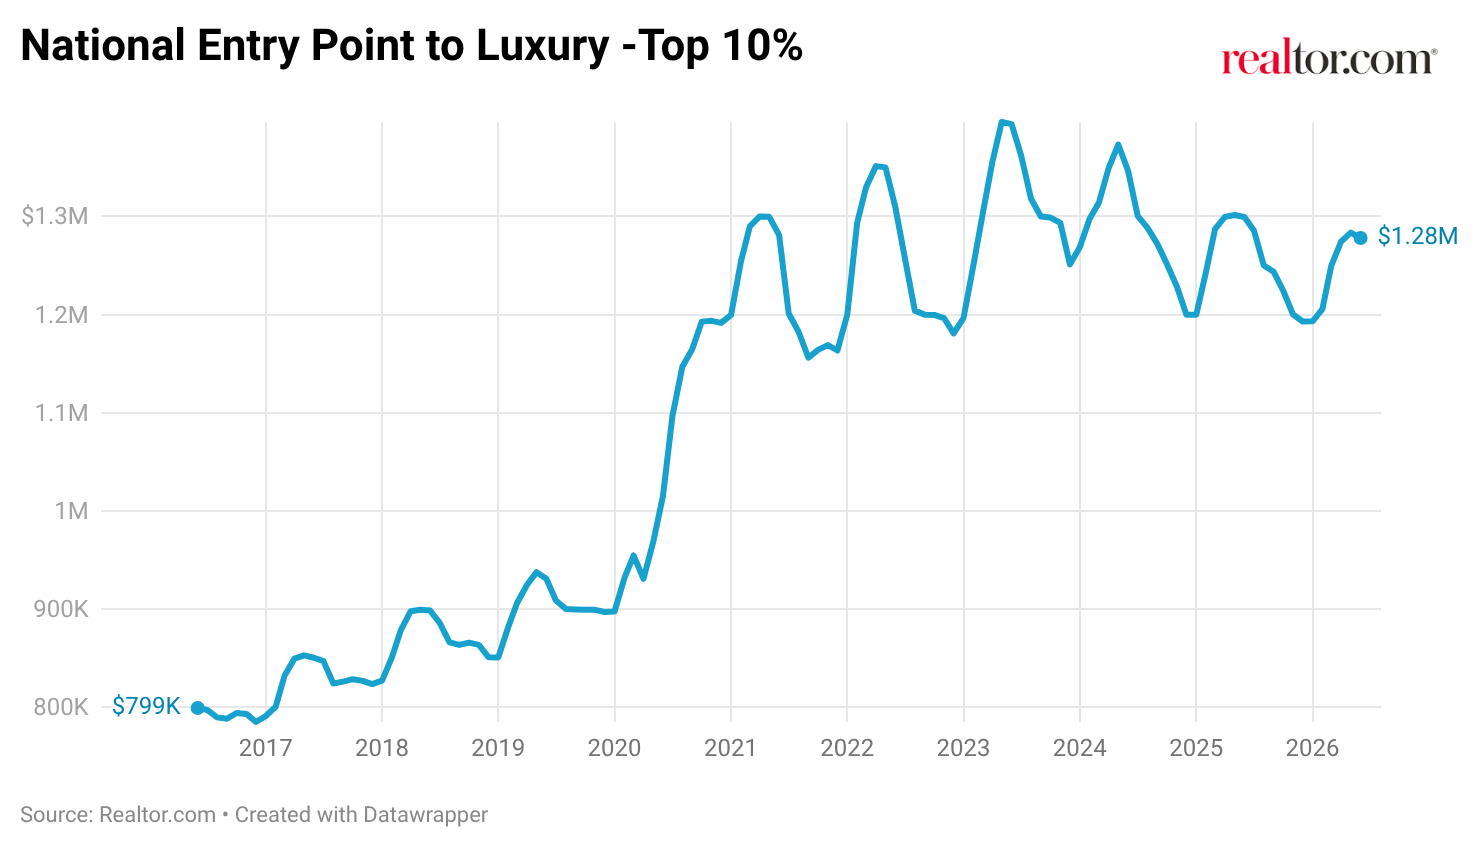
The national entry point to luxury slipped to $1,277,907 in June, down 0.4% from May and 1.7% from June 2025. This is the 27th straight month of annual decline, and it breaks from the pattern of the past few months, where the pace of year-over-year softening had been narrowing. May’s annual drop of 1.4% looked like a sign the market was finding its floor; June’s wider decline suggests that stabilization is not yet locked in.
The pattern held across tiers, with high-end luxury (95th percentile) down 3.7% year over year and ultraluxury (99th percentile) down 2.9%. The million-dollar listing share ticked down to 13.7%, off 0.1 percentage point from May and 0.5 percentage point below a year ago, pointing to inventory growth at the top of the market cooling slightly even as the segment remains well above pre-pandemic norms.
Pace of the Luxury Market
| Indicator | June 2026 | Monthly (Days) | YoY (Days) |
| Median Days on Market 90th Percentile | 63 | 5 days slower | 2 days faster |
| Median Days on Market 95th Percentile | 69 | 3 days slower | 4 days faster |
| Median Days on Market 99th Percentile | 88 | 2 days slower | 3 days faster |
| Median Days on Market Median Listing | 53 | 1 day slower | Unchanged |
Luxury homes are still moving faster than they were a year ago across every tier. The 90th percentile sold in a median of 63 days, 2 days faster than in June 2025. The 95th percentile improved by 4 days and the 99th percentile improved by 3 days over the same period. The overall median listing held flat with a year ago at 53 days. The luxury market remains modestly quicker to transact than it was last summer, even as prices continue to soften on an annual basis.
Top 10 Most Expensive Metropolitan Luxury Markets
| Rank | Area | 10% Most Expensive Listings Start at: | 10% Most Expensive MoM | 10% Most Expensive YoY | Average Annual Million-Dollar Listings Count | Multiple to National Luxury Median |
| 1 | Bridgeport-Stamford-Danbury, CT | $4,199,550 | 0.0% | -4.4% | 527 | 3.3 |
| 2 | Los Angeles-Long Beach-Anaheim, CA | $4,100,059 | -2.2% | -5.8% | 9253 | 3.2 |
| 3 | Kahului-Wailuku, HI | $3,942,500 | -0.2% | -0.4% | 713 | 3.1 |
| 4 | Naples-Marco Island, FL | $3,733,572 | -0.3% | 4.1% | 2189 | 2.9 |
| 5 | San Jose-Sunnyvale-Santa Clara, CA | $3,249,087 | -6.9% | -11.7% | 1068 | 2.5 |
| 6 | Oxnard-Thousand Oaks-Ventura, CA | $2,996,700 | -4.1% | -5.0% | 645 | 2.3 |
| 7 | New York-Newark-Jersey City, NY-NJ | $2,964,565 | 2.1% | -1.1% | 11520 | 2.3 |
| 8 | Crestview-Fort Walton Beach-Destin, FL | $2,871,781 | -4.0% | -0.9% | 1376 | 2.2 |
| 9 | San Diego-Chula Vista-Carlsbad, CA | $2,818,099 | -1.1% | -5.0% | 2290 | 2.2 |
| 10 | San Francisco-Oakland-Fremont, CA | $2,629,175 | -2.4% | -6.9% | 2387 | 2.1 |
(Among metropolitan areas that averaged at least 500 million-dollar listings over the 12 months through June 2025)
Bridgeport-Stamford-Danbury, CT, retained the top spot for a second consecutive month, with its 90th-percentile threshold essentially flat month over month at $4.2 million, though it remains down 4.4% from a year ago. Los Angeles held on to second place despite a 2.2% monthly pullback, and Kahului-Wailuku, HI, rounded out the top three with its threshold nearly unchanged year over year at -0.4%, the mildest annual move of any market on the list.
Naples-Marco Island, FL, was the only market among the 10 most expensive to post a year-over-year gain, up 4.1% to $3,733,572, continuing a trend of resilience in the Gulf Coast Florida market. On the other end, San Jose-Sunnyvale-Santa Clara, CA, saw the steepest slide in the group, down 11.7% year over year and 6.9% on the month.
One noteworthy shift is the San Francisco-Oakland-Fremont, CA metro, which returned to the top 10 this month. Santa Rosa-Petaluma, CA, which had held the No. 5 spot as recently as May, fell out of the ranking after its trailing 12-month average of million-dollar listings dropped to 494, below the 500-listing threshold used to qualify for this list. San Francisco’s threshold sits at $2,629,175, down 6.9% year over year, and its reappearance comes alongside the AI-linked liquidity dynamics we touched on last month, where equity events at Bay Area tech companies have kept some luxury demand elevated even as the broader correction continues.
Luxury Vacation
There are various locations within the U.S. where the primary draw is essentially recreation. These are places where people look to retreat from the busy and congested city life in exchange for a brief escape. There is a level of luxury where the destination is intentional, and scenery carries more value than proximity to a major economic engine.
To find which of our curated luxury areas had the highest share of vacation homes, we used U.S. Census Bureau data to identify what portion of each metro’s housing stock is set aside for seasonal, recreational, or occasional use. Using the Census Bureau’s 2020–24 American Community Survey, we calculated this share for every metro and micropolitan area in the country, then ranked them by the percentage of total housing units classified this way. To capture smaller vacation markets, the number of million-dollar listings is set to at least 100 during June 2026. Nationally, just 3.3% of the housing stock falls into this category, making the concentration in top vacation markets even more striking by comparison.
Highest Share of Vacation Homes
| Rank | Area | Metro/Micro | Share of Vacation Homes | Median Listing Price | 10% Most Expensive Listings Start at: | Median Square Feet ($1M – $2M) |
| 0 | USA | Country | 3.3% | $430,000 | $1,277,907 | 3,000 |
| 1 | Nantucket, MA | Micro | 55% | $4,925,000 | $14,117,250 | 1,011 |
| 2 | Vineyard Haven, MA | Micro | 54% | $2,500,000 | $8,235,000 | 1,652 |
| 3 | Breckenridge, CO | Micro | 46% | $948,500 | $3,725,000 | 1,754 |
| 4 | Morehead City, NC | Micro | 34% | $577,450 | $1,567,000 | 2,786 |
| 5 | Barnstable Town, MA | Metro | 33% | $909,450 | $3,355,500 | 2,402 |
| 6 | Kill Devil Hills, NC | Micro | 31% | $649,000 | $1,399,949 | 3,028 |
| 7 | Atlantic City-Hammonton, NJ | Metro | 29% | $554,500 | $2,574,050 | 1,956 |
| 8 | Heber, UT | Micro | 28% | $1,447,500 | $6,038,000 | 2,744 |
| 9 | Boone, NC | Micro | 28% | $669,738 | $1,994,400 | 3,041 |
| 10 | Edwards, CO | Micro | 28% | $1,024,500 | $5,740,750 | 1,636 |
| 11 | Key West-Key Largo, FL | Micro | 27% | $1,199,000 | $4,708,500 | 3,041 |
| 12 | Hailey, ID | Micro | 27.% | $1,299,750 | $9,655,000 | 1,636 |
| 13 | Petoskey, MI | Micro | 27% | $838,125 | $3,395,000 | 1,600 |
| 14 | Seaford, DE | Micro | 25% | $555,950 | $1,196,200 | 2,370 |
| 15 | Naples-Marco Island, FL | Metro | 25% | $699,000 | $3,733,572 | 2,881 |
(At least 100 million-dollar listings in June and at least 25% share of vacation homes)
Nantucket, MA, topped the list with 55.0% of its housing stock reserved for seasonal or occasional use, followed closely by Vineyard Haven, MA, at 54.4%. Both islands sit at roughly 17 times the national vacation-home share of 3.3%, underscoring how much of their local housing economy is built around second homes rather than primary residences. Both of these areas are also Pure Luxury Markets, where even the median home surpasses the national luxury threshold. Breckenridge, CO, rounded out the top three at 45.8%, the highest share among mountain destinations on the list.
The price points diverge sharply from the vacation-home share itself. Nantucket carries the steepest 10% threshold on the list at $14,117,250, yet its median square footage in the $1 million to $2 million range is just 1,011 square feet, the smallest on the list. That combination points to a market where land and location drive value far more than home size. Hailey, ID, shows a similar dynamic: Its median listing price sits at $1,299,750, but its 10% most expensive listings start at $9,655,000, a gap that signals a thin but extreme luxury tail layered on top of a relatively more modest broader market.
Geographically, the list is heavily concentrated in coastal and beach destinations (Nantucket, MA; Vineyard Haven, MA; Barnstable Town, MA; Morehead City, NC; Kill Devil Hills, NC; Atlantic City-Hammonton, NJ; Key West-Key Largo, FL; Seaford, DE; and Naples-Marco Island, FL) and mountain retreats (Breckenridge, CO; Heber, UT; Boone, NC; Edwards,CO; and Hailey, ID), rounded out by the lakeside market of Petoskey, MI. Notably, Naples-Marco Island, FL, is the only metropolitan area to appear on both this list and the top 10 most expensive markets list.
All data in this report is sourced from Realtor.com® listing trends as of June 2026, reflecting active inventory of existing homes, including single-family residences, condos, townhomes, row homes, and co-ops. Listings reflect only those provided by MLS platforms to Realtor.com via a listing feed. New-construction listings are excluded unless actively listed on participating MLSs.
Luxury segmentation is based on market-specific price percentiles, with the 90th percentile representing entry-level luxury, the 95th percentile marking high-end luxury, and the 99th percentile indicating ultraluxury. All calculations are based on listing prices, not final sales prices.
Metropolitan and micropolitan areas are defined using the Office of Management and Budget’s OMB-2023 delineations, with Claritas 2025 household estimates used for relative comparisons. Where appropriate, we limited analysis to metros or micros with a minimum threshold of active million-dollar listings on average over the past year to ensure meaningful comparisons.
Historical listing trend data extends to July 2016, but year-over-year comparisons in this report use June 2025 as the baseline.
Luxury by the Numbers
90th percentile = Entry-level luxury (top 10% of prices)
95th percentile = High-end luxury
99th percentile = Ultraluxury (often rare or custom properties)