


Peak vs. Heat: Two Mountain West metros trade places at the luxury tier
Known for their abundant sunshine, dramatic mountain backdrops, and outdoor lifestyles that attract transplants from across the country, the Denver-Aurora-Centennial, CO, and Phoenix-Mesa-Chandler, AZ, metros have evolved into prominent housing markets in the Mountain West. Both have experienced significant growth over the past decade, fueled by inbound migration, expanding job markets, and quality-of-life appeal that has increasingly drawn high-earning households from coastal metros. But beneath that shared appeal, their luxury real estate markets tell a story of reversal: a decade ago, Denver’s luxury entry point sat roughly $250,000 above Phoenix’s. Today, Phoenix has overtaken Denver and commands a premium of nearly $148,000 at the top of the market.
Headline Trends
- The top 10% threshold in Phoenix sits at $1,500,608, roughly 20% above the national luxury benchmark of $1,249,857. Denver’s entry point to luxury stands at $1,352,615, about 8% above the national level.
- Luxury homes in Denver clear the market in a median of 43 days, below Phoenix’s 66 days and the national luxury benchmark of 62 days. Among million-dollar homes specifically, Denver’s pace advantage holds: 37 days compared to Phoenix’s 60 days.
- Identical inventory share, different depth: Million-dollar listings make up 17.3% of total inventory in both metros, well above the national share of 13.1%. However, Phoenix carries significantly more volume: 3,403 active million-dollar listings compared to Denver’s 1,585, reflecting a broader and deeper pool of luxury properties. This is largely due to the larger market in the Phoenix metro (nearing 5.2 million in population) compared to the Denver metro (just over 3 million in population).
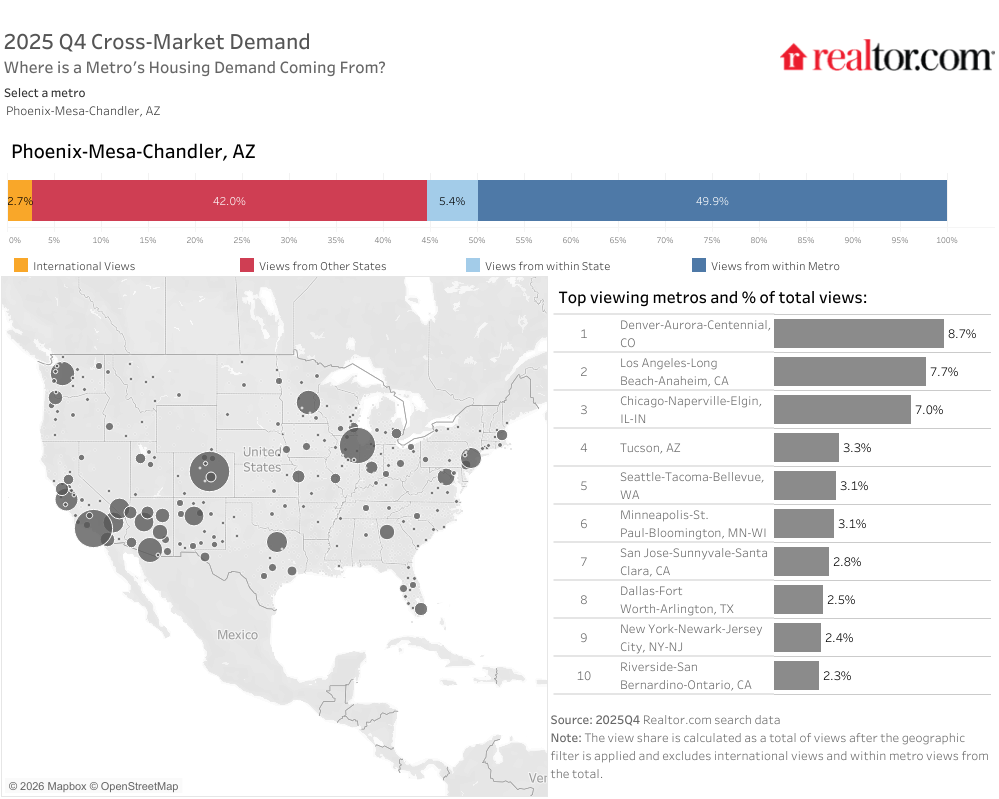
- Each metro’s biggest source of outside demand is the other: Cross-market data shows that 13.2% of Denver’s out-of-market listing demand originates from Phoenix, its single largest external source. The reverse also holds: 8.7% of Phoenix’s external demand comes from Denver.
| Area | Million-Dollar Listing Count | Share of Million Dollar Listings |
| USA | 124,249 | 13.1% |
| Denver-Aurora-Centennial, CO | 1,585 | 17.3% |
| Phoenix-Mesa-Chandler, AZ | 3,403 | 17.3% |
The Role Reversal: A Decade of Diverging Paths
A decade ago, these two luxury markets were operating at very different price levels. In the summer of 2016, Denver’s luxury entry point sat near $1.18 million, commanding a roughly $250,000 premium (27%) over Phoenix’s threshold of approximately $925,000. At the time, Denver was one of the Mountain West’s clear luxury-price leaders, supported by a growing tech segment, the energy sector, and significant inbound migration.
That landscape has since inverted. Since mid-2016, Phoenix’s luxury threshold has climbed approximately 62%, outpacing the national luxury threshold increase of 56% and outpacing Denver’s 15% gain over the same period.
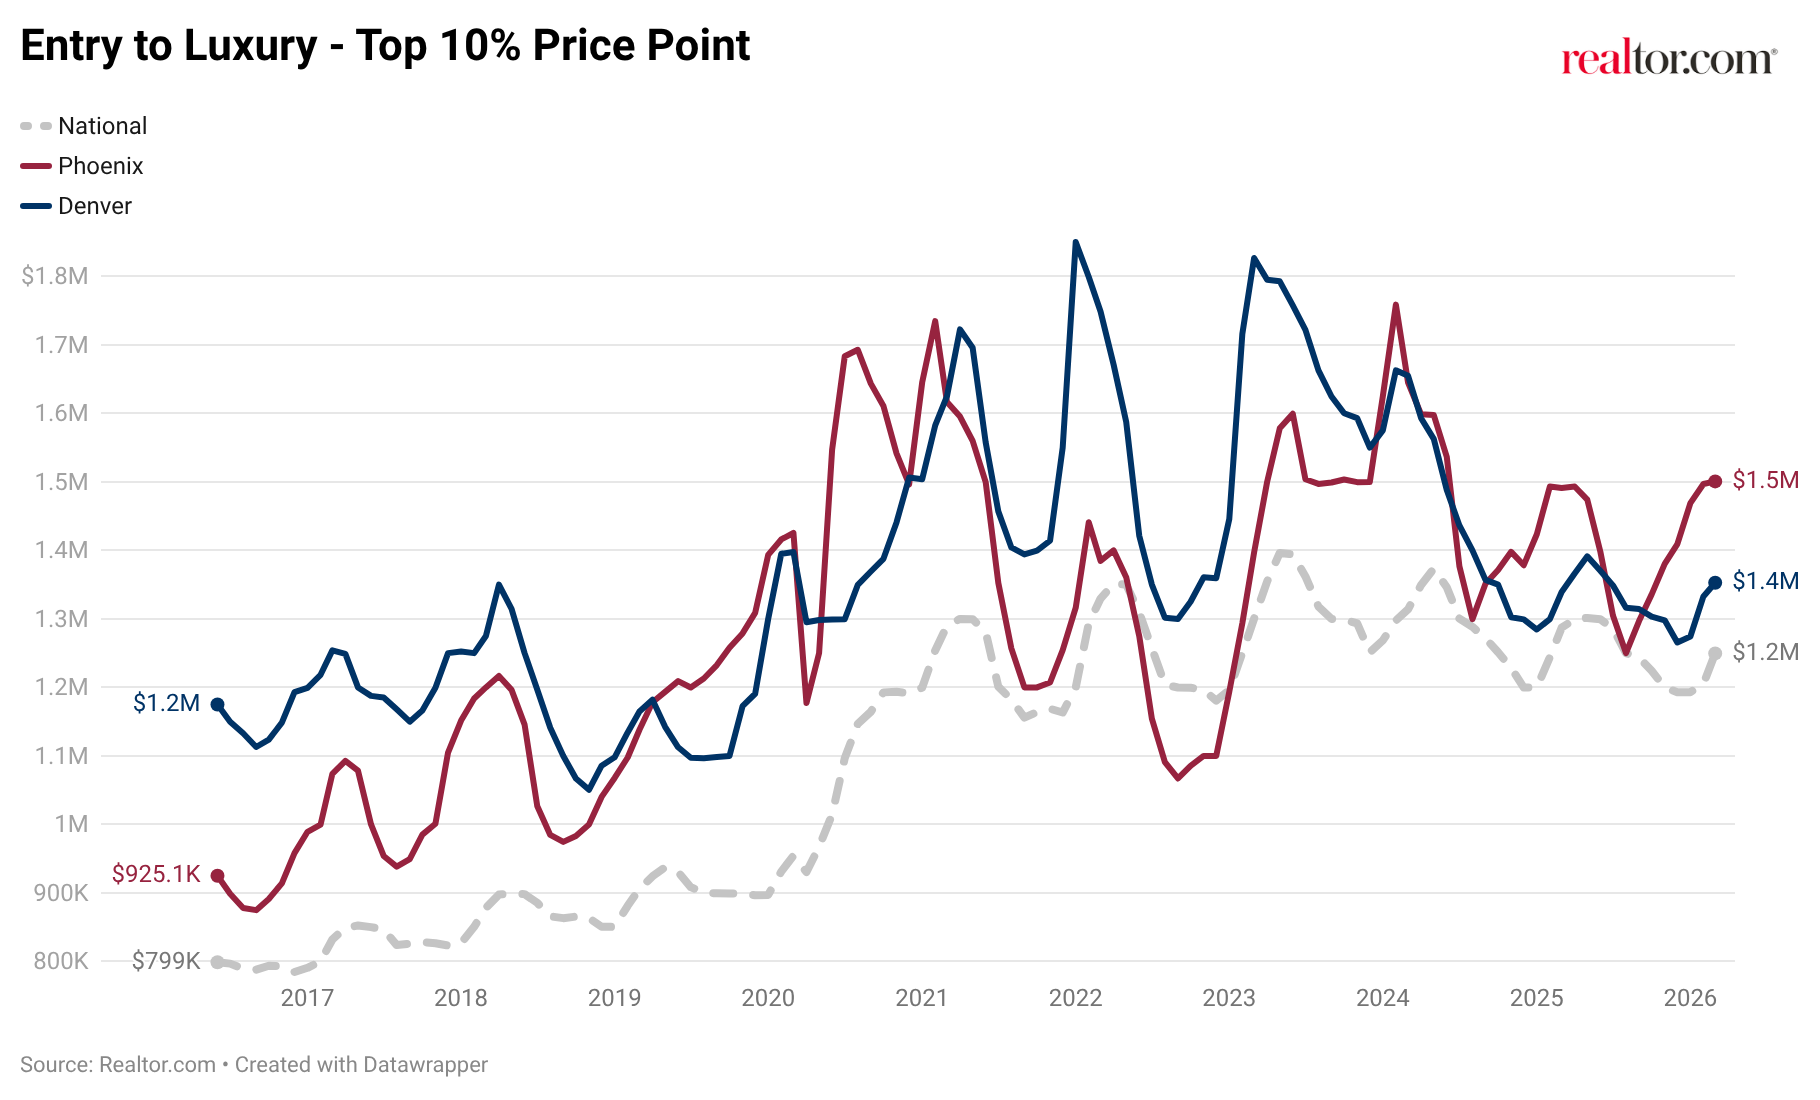
The two metros followed different pandemic-era trajectories. Denver’s luxury tier surged early, peaking at roughly $1.85 million in January 2022. From that peak, Denver’s luxury threshold worked through a pronounced correction, shedding more than 27% of its peak value before stabilizing.
Phoenix’s luxury cycle played out later. The price point for the top 10% of homes climbed more gradually, peaking at approximately $1.76 million in February 2024, two full years after Denver’s high watermark. Phoenix’s subsequent pullback was more shallow (roughly 15%), and by early 2026, the market had begun trending upward again. The result is a complete role reversal. Where Denver once held a clear luxury premium, Phoenix now sits roughly $148,000 (11%) above Denver at the 90th percentile. Reviewing trends across Denver and Phoenix, it’s clear that prices are more variable in these markets than in other similarly sized cities. The availability of land and the influx of population that these areas have seen tend to be found in areas with more abundant new construction and more volatile prices.
Luxury Tiers at a Glance
The pricing divergence between the two markets becomes even more pronounced at higher tiers:
| Area | Median Listing Price | Top 10% (Entry Luxury) | Top 5% (High-End Luxury) | Top 1% (Ultraluxury) |
| USA | $415,450 | $1,249,857 | $1,998,098 | $5,767,096 |
| Denver | $575,000 | $1,352,615 | $1,953,103 | $4,261,513 |
| Phoenix | $498,000 | $1,500,608 | $2,668,125 | $6,727,680 |
At the entry level of luxury, Phoenix holds a roughly $148,000 edge over Denver. That gap widens dramatically as you move up the price spectrum. At the 95th percentile, Phoenix’s high-end luxury threshold of $2.67 million exceeds Denver’s by more than $715,000 and sits above the national level. At the ultraluxury tier (99th percentile), Phoenix reaches $6.73 million, well above both Denver’s $4.26 million and the national ultraluxury benchmark of $5.77 million.
Phoenix’s steeper price escalation at the top reflects a market with a slightly more pronounced separation between the broader market’s median home price and its entry point to luxury. Denver’s luxury pricing, while above national benchmarks at the entry level, compresses more tightly at the top, with its ultraluxury threshold sitting below the national level.
Connected by Migration, Linked by Demand
These two metros share more than a regional identity. Cross-market listing demand data reveal that Denver and Phoenix are each other’s largest single source of out-of-market interest. Roughly 13.2% of Denver’s external listing views come from the Phoenix metro, and 8.7% of
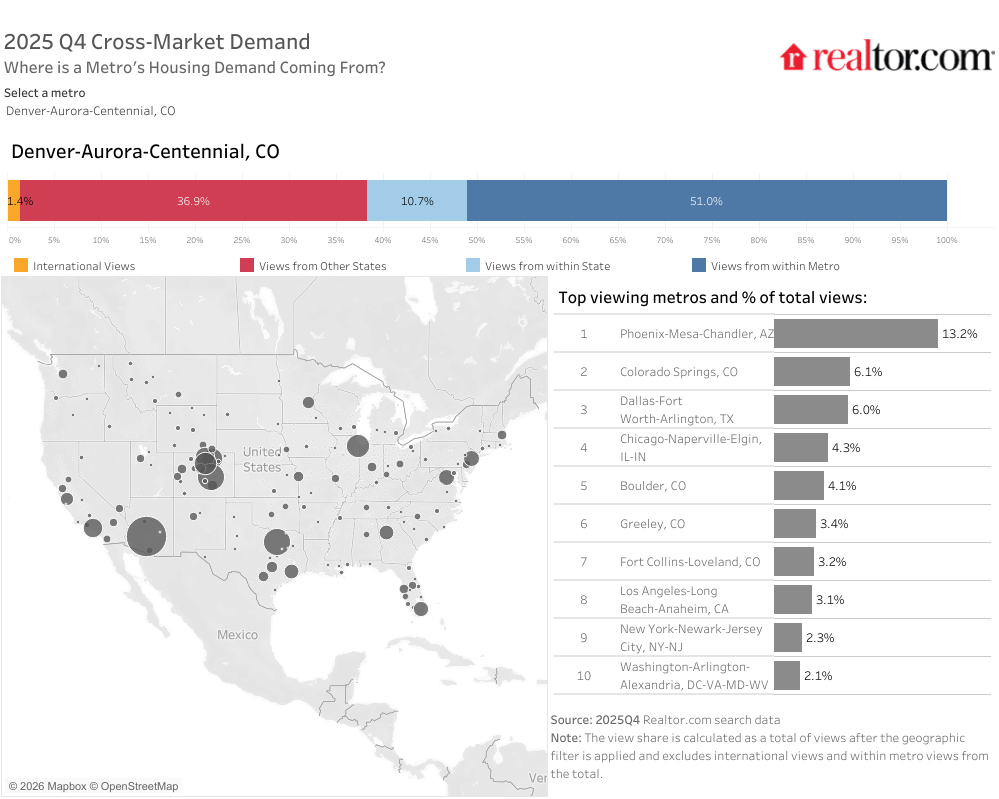
This bidirectional demand pipeline reflects a long-standing migration corridor between the two metros. Both markets can offer a high quality of life, lower costs relative to coastal metros, and access to outdoor recreation. For buyers moving from Denver to Phoenix, the draw often includes a warmer climate, no state income tax, and a deeper supply of luxury inventory. For those moving from Phoenix to Denver, the appeal may center on four-season mountain access, a more temperate summer climate, and an economic engine driven by aerospace, defense, and tech.
Luxury Tempo
Denver’s luxury market operates at a notably faster pace than both Phoenix and the national benchmark. Homes at the 90th percentile in Denver clear the market in a median of 43 days, compared with 66 days in Phoenix and 62 days nationally. Among million-dollar homes specifically, Denver maintains its speed advantage at 37 days, while Phoenix matches the national pace of 60 days.
Denver has a more compressed price range at the top of the market, and a buyer base that has historically been more decisive at the luxury level. Phoenix’s deeper luxury supply, while a strength in terms of buyer choice, naturally extends marketing times as more inventory competes for absorption.
Year-over-year, luxury pricing growth has been modest in both metros: Phoenix’s 90th percentile is up 0.6%, and Denver’s is up 1.0%, compared to a 2.9% decline nationally. Both markets are holding value at the luxury tier as the broader national luxury benchmark recalibrates.
Sunshine and Space
Both metros offer buyers newer housing stock relative to the national market, though the differences are subtle. The median year built for luxury listings in the Phoenix metro is 2005, while Denver sits at 2002, both closely bracketing the national median of 2003. Unlike the sharp contrasts seen in comparisons between Sunbelt and Northeast metros, Denver and Phoenix share a relatively modern luxury housing base shaped by decades of sustained growth and development.
| $1 Million – $2 Million Homes | ||
| Area | Median Square Feet | Price Per Square Foot |
| USA | 2,930 | $478.46 |
| Denver | 4,183 | $331.30 |
| Phoenix | 3,164 | $438.81 |
Where the Top of the Market Concentrates
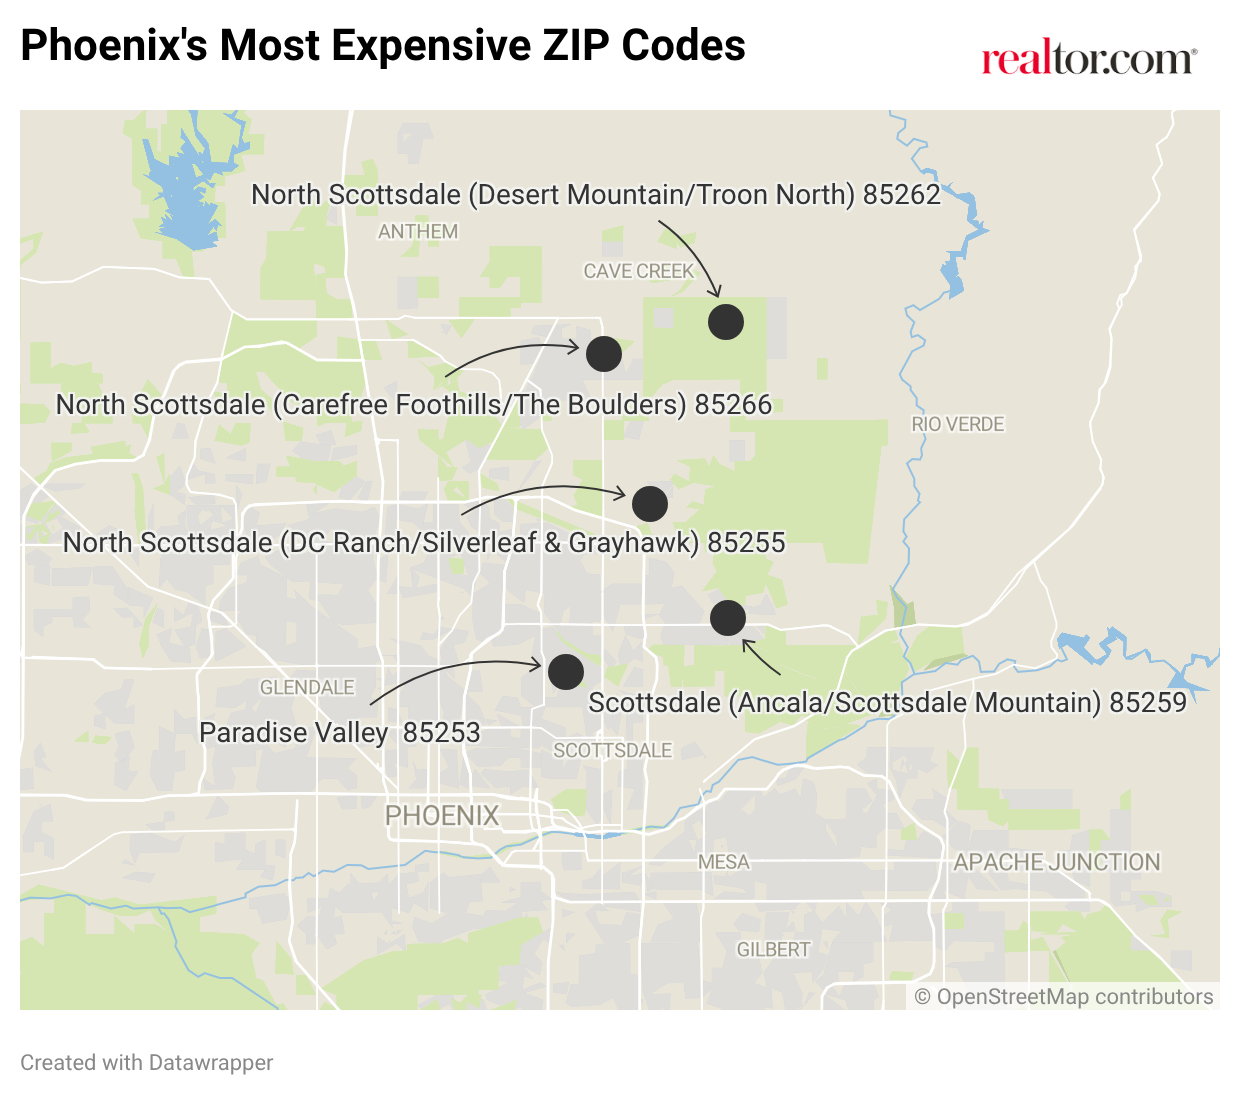
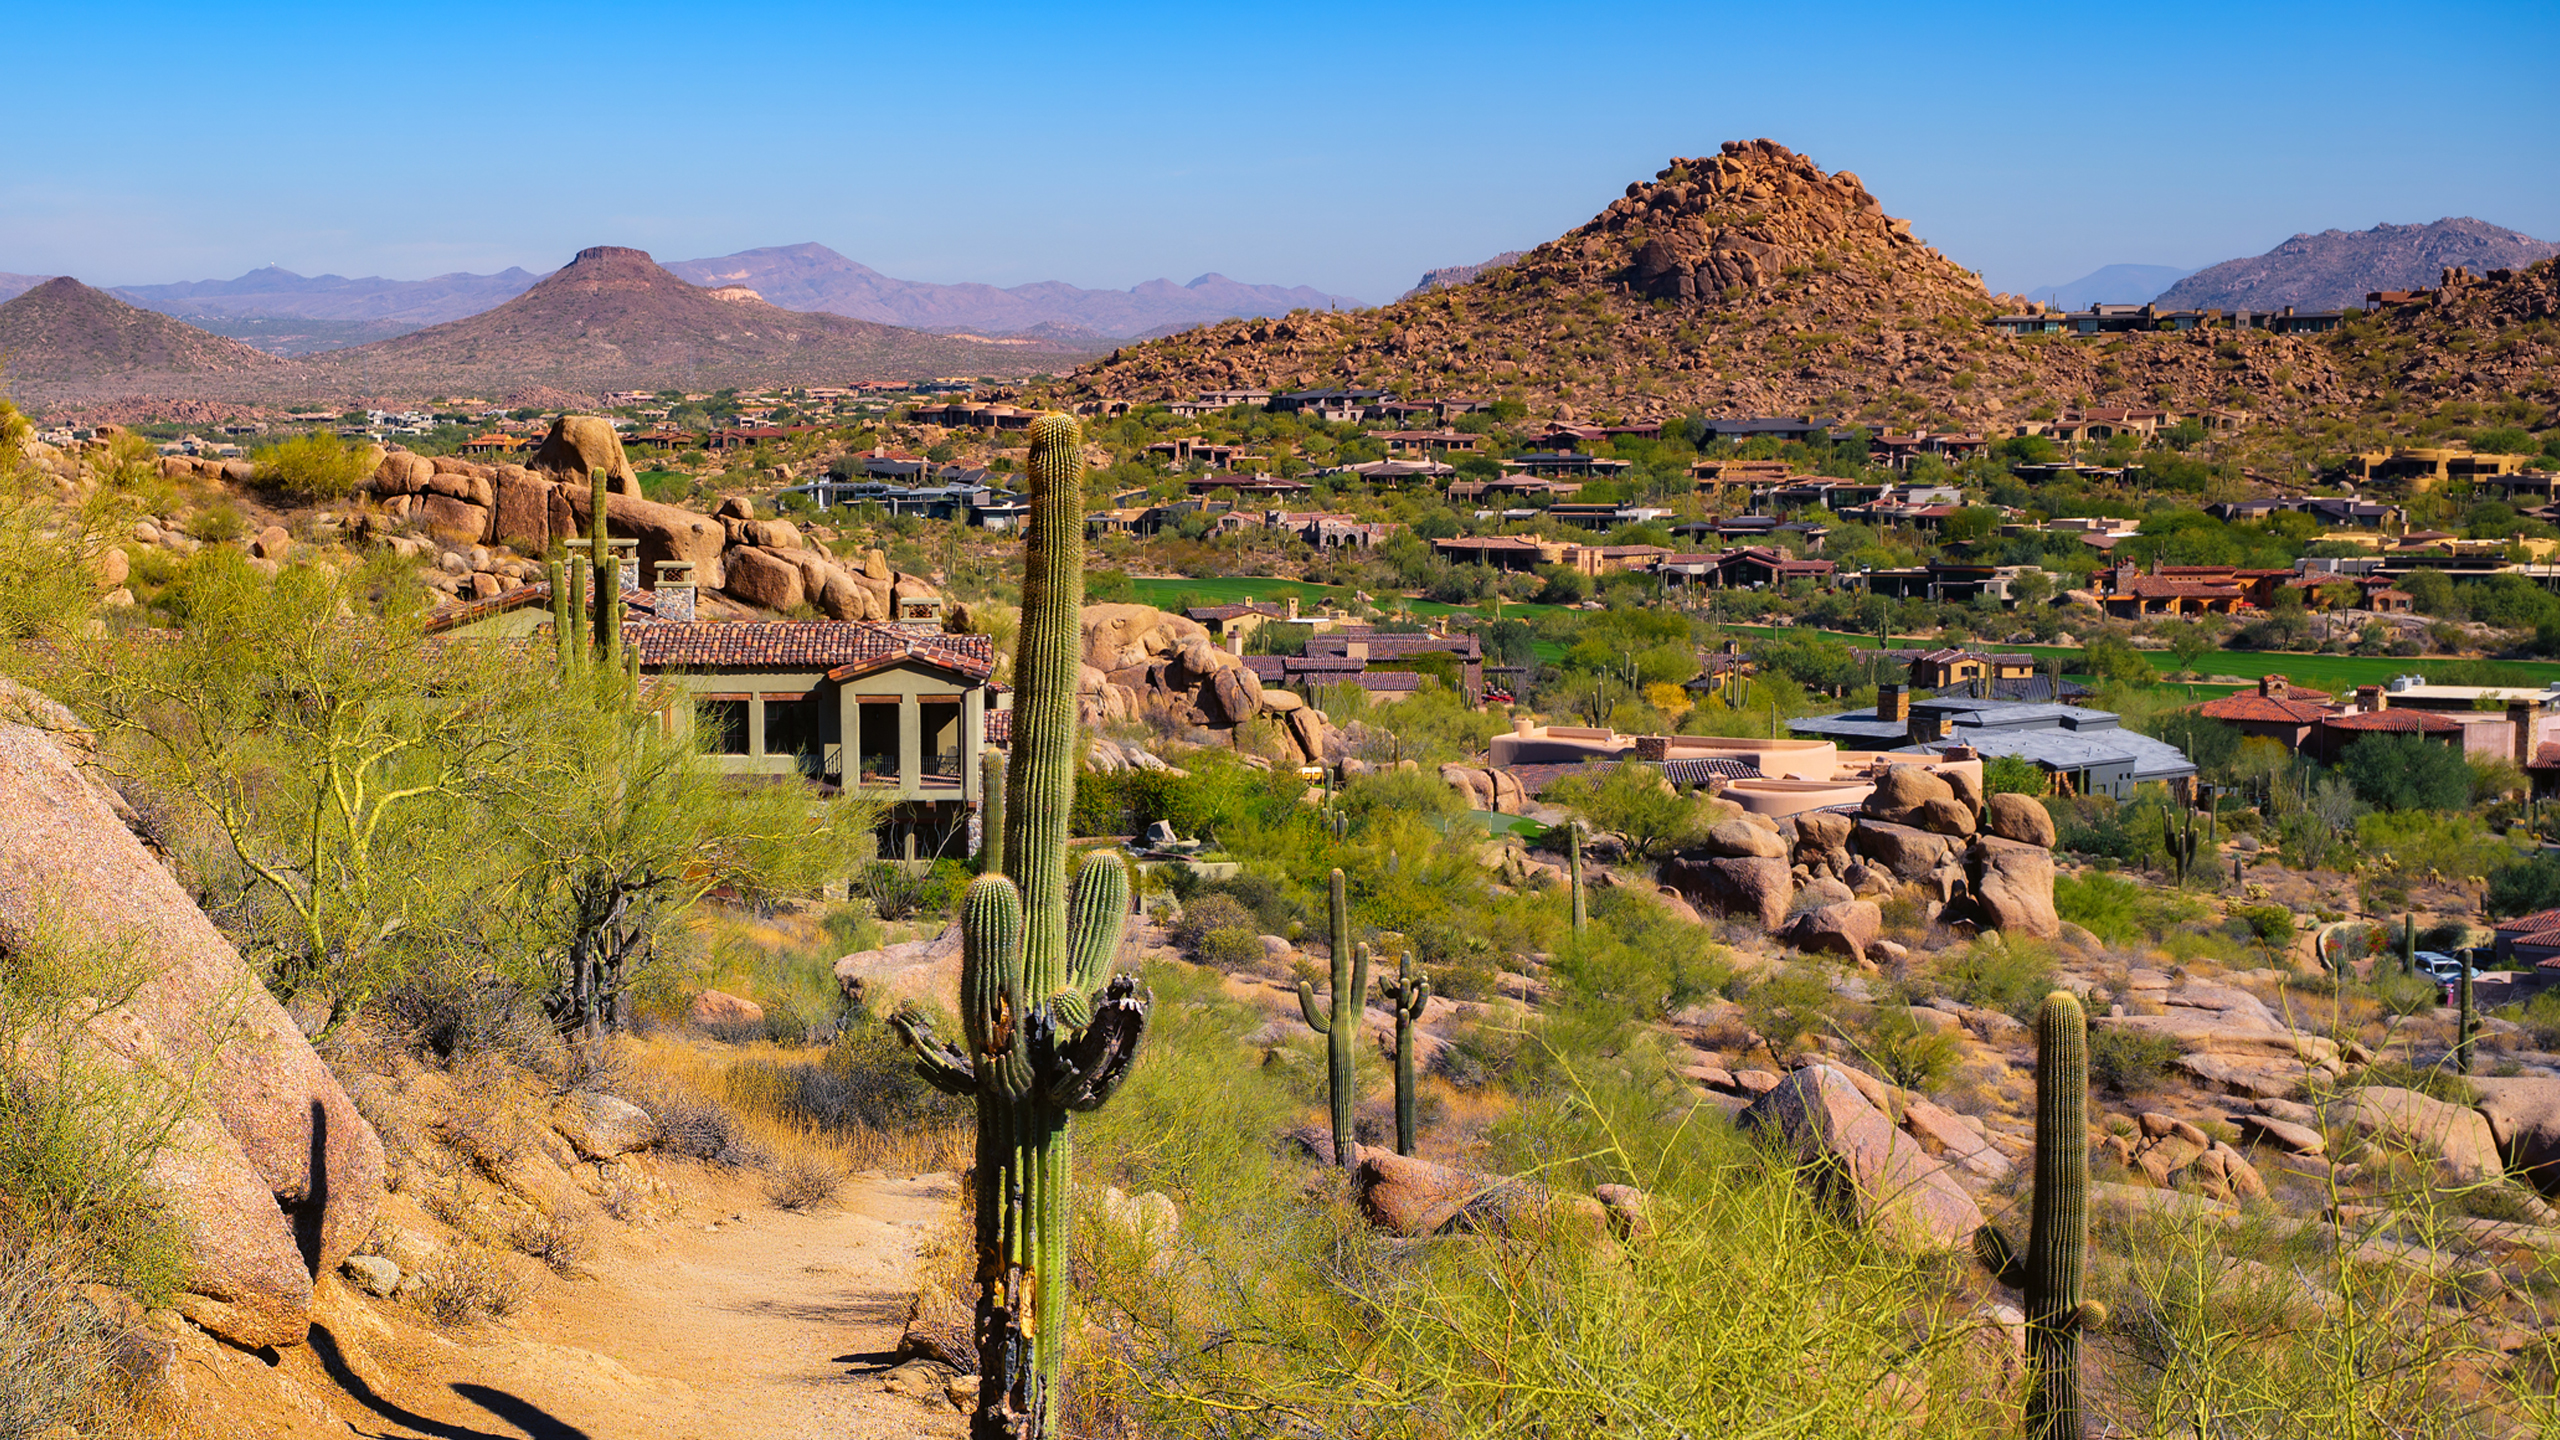
Phoenix’s luxury epicenter is concentrated in Scottsdale and Paradise Valley, a corridor that has long served as the state’s premier luxury destination.
| Rank | ZIP Code | Area | Median Listing Price | Median Sq Ft | Median Year Built |
| 1 | 85253 | Paradise Valley | $4,999,250 | 5,509 | 1995 |
| 2 | 85262 | Scottsdale (Desert Mountain/Troon North) | $2,293,573 | 3,779 | 2004 |
| 3 | 85255 | Scottsdale (DC Ranch/Silverleaf & Grayhawk) | $1,803,750 | 3,146 | 2000 |
| 4 | 85266 | Scottsdale (Carefree Foothills/The Boulders) | $1,612,500 | 3,586 | 1999 |
| 5 | 85259 | Scottsdale (Ancala/Scottsdale Mountain) | $1,534,750 | 3,218 | 1996 |
Paradise Valley (85253) sits comfortably at the very top of the Phoenix luxury market, with a median listing price of roughly $5.0 million and homes averaging more than 5,500 square feet. Known for its estate-style properties, mountain views, and strict residential zoning that prohibits commercial development, Paradise Valley has functioned as the Valley’s most exclusive enclave for decades. With 281 active listings, the ZIP also carries meaningful inventory depth at the ultraluxury level.
Getty Images
The four remaining top ZIP codes all fall within the Scottsdale corridor, reflecting how deeply luxury inventory is concentrated in the metro’s northeastern quadrant. Scottsdale’s 85262 ZIP code follows at $2.29 million, offering newer construction (median year built of 2004) on larger lots in the desert foothills. The 85255, 85266, and 85259 ZIP codes round out the top five, each posting median listing prices between $1.53 million and $1.80 million and offering a mix of golf course communities, desert contemporary homes, and gated enclaves.
Together, these five ZIP codes illustrate how Phoenix’s luxury market fans out along a single geographic corridor, from the exclusive estates of Paradise Valley through the resort-style communities of North Scottsdale.
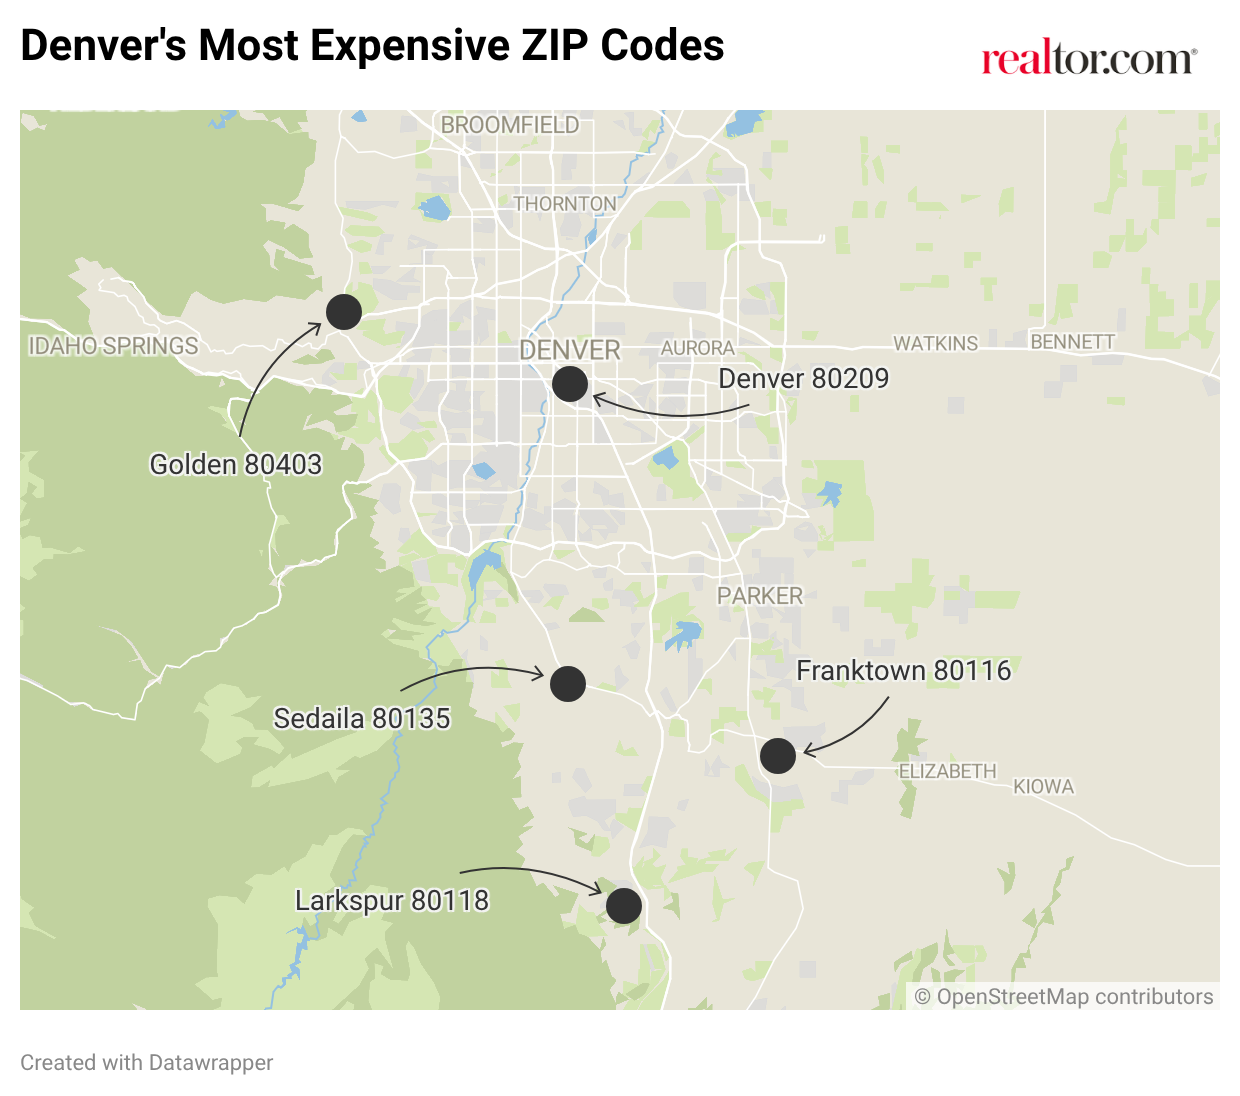
Denver’s most expensive ZIP codes present a different pattern than Phoenix’s concentrated luxury corridor, spreading across both in-town urban neighborhoods and rural estate communities along the Front Range foothills.
| Rank | ZIP Code | Area | Median Listing Price | Median Sq Ft | Median Year Built |
| 1 | 80116 | Franktown | $1,750,000 | 5,337 | 1994 |
| 2 | 80135 | Sedalia | $1,723,746 | 4,136 | 1983 |
| 3 | 80209 | Denver | $1,243,750 | 2,572 | 1959 |
| 4 | 80118 | Larkspur | $1,139,250 | 4,559 | 1999 |
| 5 | 80403 | Golden | $1,067,500 | 3,252 | 1999 |
Franktown (80116) and Sedalia (80135) lead Denver’s pricing hierarchy, posting median listing prices of $1.75 million and $1.72 million, respectively. Both are rural communities south of the metro core in Douglas County, offering large-lot estate properties with acreage, equestrian facilities, and mountain views. With median home sizes exceeding 4,100 square feet and median year-built figures in the 1980s and 1990s, these ZIP codes reflect a luxury market anchored by land and space rather than by urban walkability.
The remaining top ZIPs have median prices that sit below the market’s luxury entry point, but they illustrate the range of Denver’s luxury landscape, spanning in-town historic neighborhoods to foothills communities along the Front Range.
Denver’s 80209 ZIP code, encompassing the city’s prestigious Washington Park and Country Club neighborhoods, is the only in-town entry among the top five. At a median listing price of $1.24 million and a median year built of 1959, this ZIP offers a distinctly different luxury profile: smaller, older homes on established urban lots where value is driven by location, mature neighborhoods, and proximity to downtown rather than sheer footprint. This ZIP is also a prime example of a trend seen in other markets such as Houston: luxury enclaves tend to establish themselves early in a market’s development and tend to hold on once established.

(Photo by: Joe Sohm/Visions of America/Universal Images Group via Getty Images)
Larkspur (80118) and Golden (80403) complete the top five, representing the foothills lifestyle that defines much of Denver’s luxury market. Both offer close proximity to the mountains, newer construction, and home sizes well above the metro median.
Compared with Phoenix’s top ZIP codes, Denver’s highest-priced areas operate at a materially lower band. Paradise Valley’s median listing price of nearly $5.0 million is roughly 2.9 times that of Denver’s top ZIP, underscoring the depth gap between the two metros at the very top of the market.
The Takeaway
Denver and Phoenix represent two Mountain West luxury markets that have traded positions over the past decade.
Phoenix has emerged as the more expensive and larger luxury market, with a 90th percentile threshold that now exceeds Denver’s by nearly $148,000 and an ultraluxury tier that reaches well above national benchmarks. Its luxury inventory is more than twice as deep as Denver’s, largely due to a larger market size concentrated in the Scottsdale-Paradise Valley corridor and shaped by decades of resort-style development and inbound demand from high-cost metros.
Denver, meanwhile, operates as a leaner, faster luxury market. Its luxury tier is more compressed, with pricing that sits above national benchmarks at the entry level but falls below at the ultraluxury tier. What Denver gives up in depth and price ceiling, it gains in pace: luxury homes clear the market roughly three weeks faster than in Phoenix, reflecting tighter supply and a decisive buyer pool along the Front Range.
The connection between these metros runs deeper than regional proximity. They are each other’s primary source of cross-market demand, forming a bidirectional migration corridor where buyers weigh mountain peaks against desert heat, four seasons against year-round warmth, and a tighter luxury pool against a broader one. Whether exploring a $1.35 million entry point in Denver or a $5.0 million estate in Paradise Valley, these two metros demonstrate how the Mountain West has matured into one of the country’s most dynamic luxury housing corridors.
Methodology
All data in this report is sourced from Realtor.com® listing trends as of March 2026, reflecting active inventory of existing homes, including single-family residences, condos, townhomes, row homes, and co-ops. Listings reflect only those posted on MLS platforms that provide listing feeds to Realtor.com. New-construction listings are excluded unless actively listed on participating MLSs.
Metropolitan and micropolitan areas are defined using the Office of Management and Budget’s OMB-2023 delineations, with Claritas 2025 household estimates used for relative comparisons. Where appropriate, we limited the analysis to metros or micros with a minimum average number of active million-dollar listings over the past year to ensure meaningful comparisons.
Historical listing trend data extends to July 2016, but year-over-year comparisons in this report use March 2025 as the baseline.
Luxury by the Numbers
90th percentile = Entry-level luxury (top 10% of prices)
95th percentile = High-end luxury
99th percentile = Ultraluxury (often rare or custom properties)


