


What did pending home sales look like in September?
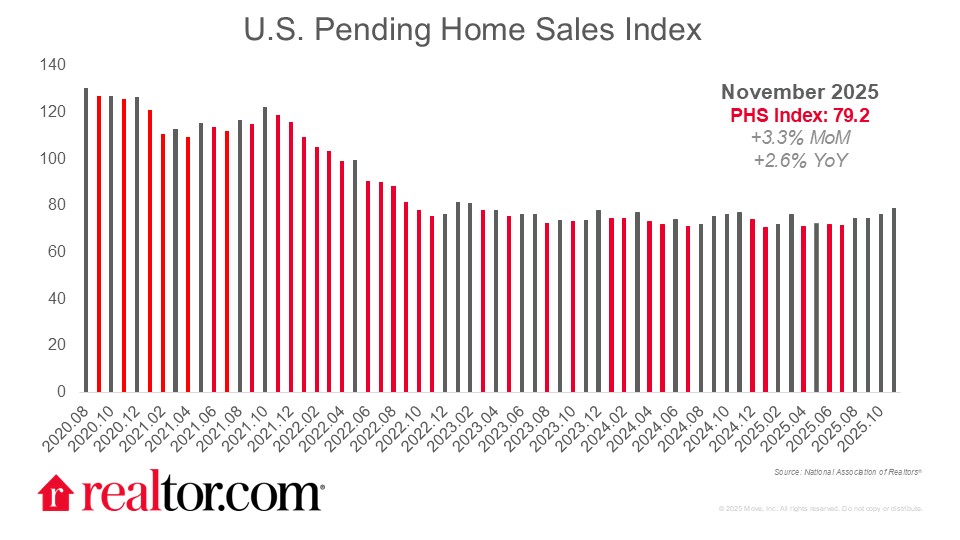
Pending home sales rose again in November, climbing 3.3% month-over-month as lower borrowing costs continued to draw in buyers aiming to close before year-end. Contract signings were also up on an annual basis, rising 2.6% year-over-year. Mortgage rates hovered near 6.2% throughout the month, while home prices remained relatively steady, offering slightly more favorable conditions for shoppers late in the year.
While the national housing market has stabilized, conditions continue to vary widely by region. Inventory levels grew fastest year over year in the West and South in November, while gains in the Midwest and Northeast lagged. All four regions saw contract signings pick up both month-over-month and year-over-year. The West (+9.2%) and the South (+2.4%) led the Northeast (+1.8%) and Midwest (+1.3%) in monthly gains. On an annual basis, the South (+3.3%) saw the biggest pickup, followed by the West (+2.4%), the Midwest (+2.2%) and the Northeast (+2.6%).
What does this mean for buyers, sellers, and the housing market?
Pending home sales, also known as contract signings, represent the first formal step in the homebuying process, when buyers and sellers agree on price and terms. Because pending sales typically lead existing home sales by one to two months, they serve as a useful indicator of near-term market activity.
September’s flat pending home sales translated into a modest uptick in existing home sales in November, though both measures remain below year-ago levels. This recent momentum reflects the combined effects of easing mortgage rates and gradually improving supply. Still, despite these tailwinds, the housing market remains in a low gear, with both buyer and seller activity subdued.


